Top

Patterns in UX Research

User Dialogues

Creating exceptional user experiences through research

A column by Steve Baty
February 23, 2009

One of the key objectives of user research is to identify themes or threads that are common across participants. These patterns help us to turn our data into insights about the underlying forces at work, influencing user behavior.

Patterns demonstrate a recurring theme, with data or objects appearing in a predictable manner. Seeing a visual representation of the data is usually enough for us to recognize a pattern. However, it is much harder to see patterns in raw data, so identifying patterns can be a daunting task when we face large volumes of research data. Patterns stand out above the typical noise we’re used to seeing in nature or in raw data.

Champion Advertisement
Continue Reading…

Types of Patterns

There are a number of different types of patterns that can provide useful insights, including

  • trends—A trend is the gradual, general progression of data up or down.
  • repetitions—A repetition is a series of values that repeat themselves.
  • cycles—A cycle is a regularly recurring series of data.
  • feedback systems—A feedback system is a cycle that gets progressively bigger or smaller because of some influence.
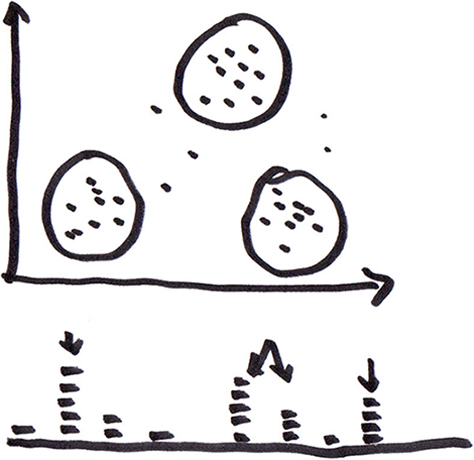
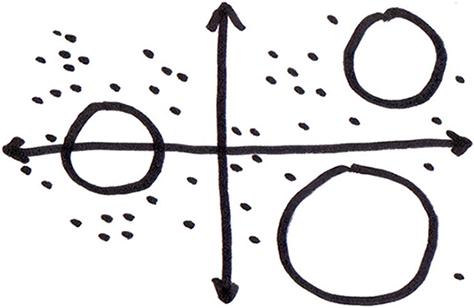
  • clusters—A cluster is a concentration of data or objects in one small area.
  • gaps—A gap is an area in which there is an absence of data.
  • pathways—A pathway is a sequential pattern of data.
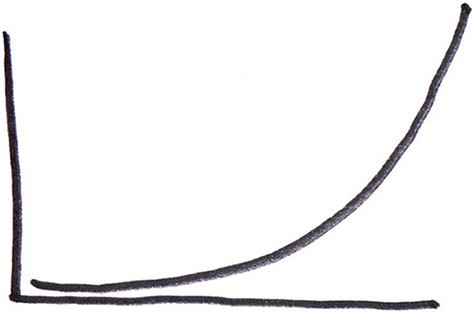
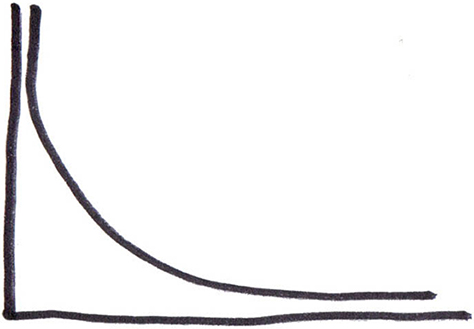
  • exponential growth—In exponential growth, there is a rapidly increasing rate of growth.
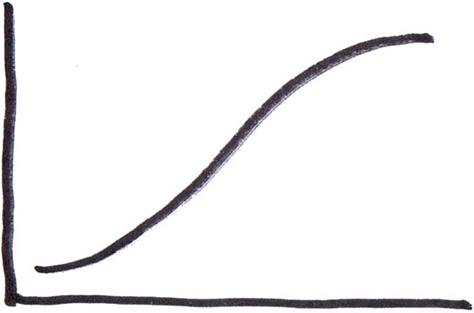
  • diminishing returns—When there are diminishing returns, there is a gradually decreasing rate of growth.
  • long tails—The Long Tail is a pattern that rises steeply at the start, falls sharply, then levels off over a large range of low values.

Let’s look at each of these types of patterns in more detail.

Trends

When data shows a clear trend, all data progresses in the same direction. In an upward trend, each subsequent piece of data is higher than the last, In a downward trend, each subsequent piece of data is lower than the last. Trends can show up in various types of data such as site visits, subscriptions, and transactions.

In a trend, the progression of data up or down is almost never completely smooth. Every now and again, the data will dip down or shoot up, against the general trend. If you plot the data as a graph, the line will look jagged and rough.

Recognizing trends is often a matter of looking at the data at the appropriate level of scale. If we look at data too closely, all we see is a series of peaks and troughs, lacking any real sense of a direction. However, when we zoom out and view a greater range of data at a time, the overall shape of the data becomes much clearer.

Identifying trends—particularly when viewing data you’ve collected over a long period of time—can be difficult if the length of time each data point represents is short. Because the data constantly shifts up and down, an upward trend can appear to be heading downward or vice versa. For example, we see this in debates about global warming. If you look at just the last few years’ data, it’s difficult to identify a trend. If anything, temperatures appear to be dropping. Over the past 100 years, however, the upward trend is clear.

Repetitions

Often, in data, we’ll see a series of numbers or values repeating themselves. In a repetition, one value might consistently follow another or, when a value occurs, it might repeat three or four times before shifting to another value. Repetitions are slightly, but significantly different from cycles, which I’ll discuss next, in that the entire sequence does not recur.

Repetitions can indicate either that a process is stuck or that there’s some kind of relationship between one event and another—a causal relationship perhaps. For example, a longer task completion time might be followed consistently by very short times that result from task abandonment.

Cycles

Cycles like those shown in Figure 1 are easily recognizable, because each segment of the data looks similar. In a cycle, there is a regularly recurring pulse or beat that is reminiscent of the beat of a heart or the ebb and flow of the tides.

Figure 1—A cycle
Cycle

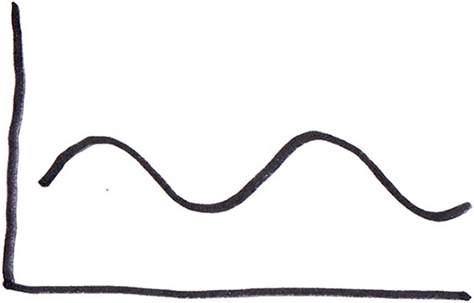
Cycles indicate some underlying rhythm to an event you’re observing and measuring. Examples might include the rise and fall of Web site traffic during a day, the Christmas peak at an online store, the subsequent peak in eBay sales just after Christmas, or an increase in online gaming time during each summer break.

Recognizing the presence of a cycle and understanding the driving forces behind it can help you plan ahead and gain deeper insights into your audience.

Cycles can also alert you to the presence of negative forces, acting against growth. For example, advertising campaigns drive sales, which can increase the load on a poorly designed logistics and customer service system, resulting in unhappy customers who spread the word about their poor experience, thereby reducing demand on the logistics and customer service teams. The net result is that the volume of sales rises, then drops.

Feedback Systems

As depicted in Figure 2, feedback systems are like cycles that get bigger and bigger—or smaller and smaller—because some influence gives the system a small kick each time around. For example, sites that perform well during busy, seasonal periods such as Christmas or Thanksgiving, because they deliver good service and provide a good experience, might still see sales drop off during the rest of the year—only to see them peak at even higher levels during the same periods in the following year.

Figure 2—Feedback systems
Feedback systems

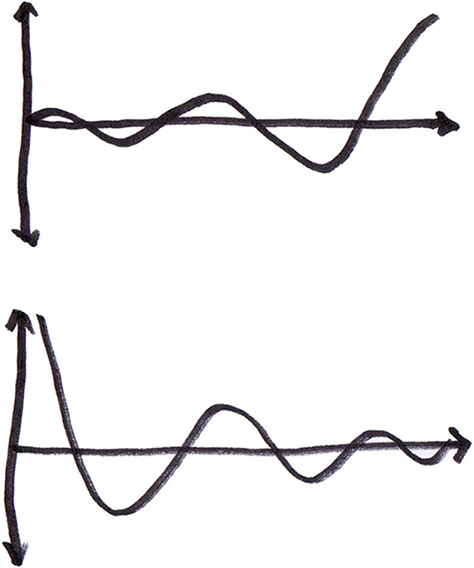
Feedback patterns can also indicate that a process is out of control. Variations become more and more accentuated as one event exacerbates the next. The infrastructure issues Twitter experienced in the early part of 2008 could serve as an example. Small improvements in capacity led to greatly increased traffic, resulting in the system’s becoming overwhelmed once more.

Clusters

When clustering occurs in your data, you may see a concentration of objects in just one small area, or data might group in several areas, as shown in Figure 3, depending on what you’re testing or researching. A cluster might represent something as simple as the task completion times on two different versions of a design or the distinguishing characteristics of subcultures in a major urban center.

Figure 3—Clusters
Clusters

Depending on where your research task sits on the complexity scale, your approach to identifying clusters will vary. In simple cases, where you’re dealing with just one or two characteristics, you can use a two-dimensional visualization to highlight each concentration. For more complex cases, identifying clusters may require statistical analysis.

When relying on statistical analysis to identify clusters, it is important to use a technique that is flexible, in terms of the number of clusters it generates. Unlike, say, in a card-sorting exercise, there is no desired number of clusters. Knowing how many concentrations are present is just as important as knowing where they fall.

Gaps

The opposite of clusters, gaps in our data represent the absence of any observable data, which can be just as informative as actual observations. For example, looking through the demographic data you’ve gathered about your customers may highlight an untapped market segment, or you might realize your targeted early-adopters are not visiting your site. Perhaps your site is showing a significant drop in sales during summer or your expected sales from Asia haven’t materialized. Whatever the scenario, gaps like those shown in Figure 4 tell us about opportunities.

Figure 4—Gaps
Gaps

An alternative way of visualizing data that has multiple dimensions is to use a radial chart. Although radial charts are harder to read, you can use them to identify gaps in data that would otherwise require statistical analysis.

Pathways

When you gather sequential data—to record traffic through a Web site or the search phrases users enter into a search engine during a session—you can use it to identify major pathways. These are the well-trodden paths of the Internet.

The aim in analyzing pathways is to be able to present the data’s branches and progression—from node 1 to node 2a or 2b and so on. Higher-use paths receive a higher value, and you use a thicker line or a different color to identify the track most users are following. Analyzing pathways isn’t really a case of seeing a pattern, so much as it is about recording, manipulating, and visualizing your data in a way that clearly illustrates a pattern.

One way of doing this is by hand. Describe each branch in the path for each sequence, then keep a tally against each alternative branch with a tick mark or a slightly thicker line.

Exponential Growth

A constantly increasing rate of growth characterizes exponential growth, as illustrated in Figure 5. Exponential growth rates are typical of early adoption stages in a technology lifecycle, the presence of network effects, or the viral spread of an advertising campaign.

Figure 5—Exponential growth
Exponential growth

Diminishing Returns

Following an initial period of rapid growth, diminishing returns occur when the growth curve flattens out—still rising, but at a much slower rate, as shown in Figure 6. It is clear that the curve is reaching some limit, possibly because of increasing competition or market saturation. We typically associate this pattern with mature products, and the presence of a diminishing-return pattern can serve as a trigger for a more creative approach to product enhancement. For example, you might pare away features to refocus your product rather than adding more and more features. Or you might completely re-evaluate the way a product addresses a users’ problems.

Figure 6—Diminishing returns
Diminishing returns

The Long Tail

In a long-tail pattern like that illustrated in Figure 7, the data rises steeply, then falls off sharply, and levels off over a large range of low values. The Long Tail is an example of a power law distribution that is common in nature—and Web sites, book sales, and music downloads. The presence of a long-tail pattern might simply tell you that things are working normally, but it can also highlight any deviations from the expected patterns in your data.

Figure 7—The Long Tail
The Long Tail

In Summary

Uncovering patterns in our user research data is one of the primary objectives of analysis. Each pattern indicates the presence of particular influences or drivers that affect the behavior of a system or the performance of the users who use that system.

The ability to successfully manipulate and visualize data—and identify and interpret such patterns—forms a critical toolset for UX designers. Recognizing patterns in user research data provides designers with a way to accelerate and bolster the move from insight to design enhancement. 

Co-founder & Principal at Meld Studios

Sydney, New South Wales, Australia

Steve BatyFocusing on the business side of the user experience equation, Steve has over 14 years of experience as a UX design and strategy practitioner, working on Web sites and Web applications. Leading teams of user experience designers, information architects, interaction designers, and usability specialists, Steve integrates user and business imperatives into balanced user experience strategies for corporate, not-for-profit, and government clients. He holds Masters degrees in Electronic Commerce and Business Administration from Australia’s Macquarie University (MGSM), and a strong focus on defining and meeting business objectives carries through all his work. He also holds a Bachelor of Science in Applied Statistics, which provides a strong analytical foundation that he further developed through his studies in archaeology. Steve is VP of the Interaction Design Association (IxDA), a member of IA Institute and UPA, founder of the UX Book Club initiative, Co-Chair of of UX Australia, and an editor and contributor for Johnny Holland.  Read More

Other Columns by Steve Baty

Other Articles on User Research

New on UXmatters