Top

Strengths and Weaknesses of Quantitative and Qualitative Research

Insights from Research

Walking in your customers’ shoes

September 3, 2012

Both qualitative and quantitative methods of user research play important roles in product development. Data from quantitative research—such as market size, demographics, and user preferences—provides important information for business decisions. Qualitative research provides valuable data for use in the design of a product—including data about user needs, behavior patterns, and use cases. Each of these approaches has strengths and weaknesses, and each can benefit from our combining them with one another. This month, we’ll take a look at these two approaches to user research and discuss how and when to apply them.

Champion Advertisement
Continue Reading…

Quantitative Studies

Quantitative studies provide data that can be expressed in numbers—thus, their name. Because the data is in a numeric form, we can apply statistical tests in making statements about the data. These include descriptive statistics like the mean, median, and standard deviation, but can also include inferential statistics like t-tests, ANOVAs, or multiple regression correlations (MRC). Statistical analysis lets us derive important facts from research data, including preference trends, differences between groups, and demographics.

Multivariate statistics like the MRC or stepwise correlation regression break the data down even further and determine what factors—such as variances in preferences—we can attribute to differences between specific groups such as age groups. Quantitative studies often employ automated means of collecting data such as surveys, but we can also use other static methods—for example, examining preferences through two-alternative, forced-choice studies or examining error rates and time on task using competitive benchmarks.

Quantitative studies’ great strength is providing data that is descriptive—for example, allowing us to capture a snapshot of a user population—but we encounter difficulties when it comes to their interpretation. For example, Gallup polls commonly provide data about approval rates for the President of the United States, as shown in Figure 1, but don’t provide the crucial information that we would need to interpret that data.

Figure 1—Quantitative data for Gallup’s presidential approval poll
Quantitative data for Gallup’s presidential approval poll

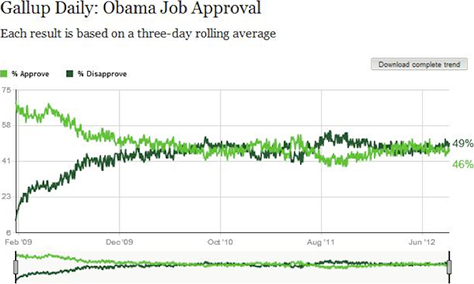
In the absence of the data that would be necessary to interpret these presidential job-approval numbers, it’s difficult to say why people approve or disapprove of the job that President Obama is doing. Some respondents may feel that President Obama is too liberal, while others may feel that he is too conservative in his actions, but without the necessary data, there is no way to tell.

In a product-development environment, this data deficiency can lead to critical errors in the design of a product. For example, a survey might report that the majority of users like 3D displays, which may lead to a product team’s choosing to integrate a 3D display into their product. However, if most users like only autostereoscopic 3D displays—that is, 3D displays that don’t require their wearing glasses—or like 3D displays only for watching sports or action movies on a television, using a 3D display that requires glasses for data visualization on a mobile device might not be a sound design direction.

Additionally, only someone with a firm grasp of how they should use and interpret quantitative statistics should conduct such a study. For most tests, there is an overreliance on the p-value and sample size. The p-value is a statistic that indicates the likelihood that research findings were the result of chance. If a p-value is less than .05, the findings are said to be statistically significant—meaning there is less than a 5% chance that the results were the result of chance.

It’s possible to manipulate a p-value by the sample size, but you need a sufficient sample size to have enough statistical power to determine whether a finding is accurate. If your study is underpowered because of its having two small a sample size, you may fail to achieve statistical significance—even if the finding is accurate. On the other hand, if you achieve statistical significance with a small sample size, you don’t need to increase your sample size; the finding is true regardless. While the small sample size makes it more difficult to determine something, if you are able to determine something with a small sample size, it’s just as true as if you made the finding with a large sample size.

By increasing the sample size, you can increase a finding’s statistical power, but perhaps to a point where the finding becomes less meaningful. There’s a common joke that a researcher can make any finding statistically significant simply by increasing the sample size. The reality is not too far off. However, it is possible to increase sample sizes to a point where statistical significance is barely meaningful. In such a situation, it is important to look at the effect sizea statistic that tells you how strongly your variables effect the variance.

Basically, statistical significance tells you whether your findings are real, while effect size tells you how much they matter. For example, if you were investigating whether adding a feature would increase a product’s value, you could have a statistically significant finding, but the magnitude of the increase in value might very small—say a few cents. In contrast, a meaningful effect size might result in an increase in value of $10 per unit. Typically, if you are able to achieve statistical significance with a smaller sample size, the effect size is fairly substantial. It is important to take both statistical significance and effect size into account when interpreting your data.

Qualitative Studies

Data from qualitative studies describes the qualities or characteristics of something. You cannot easily reduce these descriptions to numbers—as you can the findings from quantitative research; though you can achieve this through an encoding process. Qualitative research studies can provide you with details about human behavior, emotion, and personality characteristics that quantitative studies cannot match. Qualitative data includes information about user behaviors, needs, desires, routines, use cases, and a variety of other information that is essential in designing a product that will actually fit into a user’s life.

While quantitative research requires the standardization of data collection to allow statistical comparison, qualitative research requires flexibility, allowing you to respond to user data as it emerges during a session. Thus, qualitative research usually takes the form of either some form of naturalistic observation such as ethnography or structured interviews. In this case, a researcher must observe and document behaviors, opinions, patterns, needs, pain points, and other types of information without yet fully understanding what data will be meaningful.

Following data collection, rather than performing a statistical analysis, researchers look for trends in the data. When it comes to identifying trends, researchers look for statements that are identical across different research participants. The rule of thumb is that hearing a statement from just one participant is an anecdote; from two, a coincidence; and hearing it from three makes it a trend. The trends that you identify can then guide product development, business decisions, and marketing strategies.

Because you cannot subject these trends to statistical analysis, you cannot validate trends by calculating a p-value or an effect size—as you could validate quantitative data—so you must employ them with care. Plus, you should continually verify such data through an ongoing qualitative research program.

With enough time and budget, you can engage in an activity called behavioral coding, which involves assigning numeric identifiers to qualitative behavior, thus transforming them into quantitative data that you can then subject to statistical analysis. In addition to the analyses we described earlier, behavioral coding lets you perform a variety of additional analyses such as lag sequential analysis, a statistical test that identifies sequences of behavior—for example, those for Web site navigation or task workflows.?However, applying behavioral coding to your observations is extremely time consuming and expensive. Plus, typically, only very highly trained researchers are qualified to encode behavior. Thus, this approach tends to be cost prohibitive.

Additionally, because it is not possible to automate qualitative-data collection as effectively as you can automate quantitative-data collection, it is usually extremely time consuming and expensive to gather large amounts of data, as would be typical for quantitative research studies. Therefore, it is usual to perform qualitative research with only 6 to 12 participants, while for quantitative research, it’s common for there to be hundreds or even thousands of participants. As a result, qualitative research tends to have less statistical power than quantitative research when it comes to discovering and verifying trends.

Using Quantitative and Qualitative Research Together

While quantitative and qualitative research approaches each have their strengths and weaknesses, they can be extremely effective in combination with one another. You can use qualitative research to identify the factors that affect the areas under investigation, then use that information to devise quantitative research that assesses how these factors would affect user preferences. To continue our earlier example regarding display preferences: if qualitative research had identified display type—such as TV, computer monitor, or mobile phone display—the researchers could have used that information to construct quantitative research that would let them determine how these variables might affect user preferences. At the same time, you can build trends that you’ve identified through quantitative research into qualitative data-collection methods and, thus verify the trends.

While this might sound contrary to what we’ve described above, the approach is actually quite straightforward. An example of a qualitative trend might be that younger users prefer autostereoscopic displays only on mobile devices, while older users prefer traditional displays on all devices. You may have discovered this by asking an open-ended, qualitative question along these lines: “What do you think of 3D displays?” This question would have opened up a discussion about 3D displays that uncovered a difference between stereoscopic displays, autostereoscopic displays, and traditional displays. In a subsequent quantitative study, you could address these factors through a series of questions such as: “Rate your level of preference for a traditional 3D display—which requires your using 3D glasses—on a mobile device,” with options ranging from strongly prefer to strongly dislike. An automated system assigns a numeric value to whatever option a participant chooses, allowing a researcher to quickly gather and analyze large amounts of data.

Conclusion

When setting out to perform user research—whether performing the research yourself or assigning it to an employee or a consultant—it is important to understand the different applications of these two approaches to research. This understanding can help you to choose the appropriate research approach yourself, understand why a researcher has chosen a particular approach, or communicate with researchers or stakeholders about a research approach and your overarching research strategy. The examples we’ve provided here provide just a small sampling of the many ways in which can analyze and employ qualitative and quantitative data. In what other ways do you use and combine qualitative and quantitative research? 

VP, UX & Consumer Insights at 30sec.io

Co-Founder and VP of Research & Product Development at Metric Lab

Redwood City, California, USA

Demetrius MadrigalDemetrius truly believes in the power of user research—when it is done well. With a background in experimental psychology, Demetrius performed research within a university setting, as well as at NASA Ames Research Center before co-founding Metric Lab with long-time collaborator, Bryan McClain. At Metric Lab, Demetrius enjoys innovating powerful user research methods and working on exciting projects—ranging from consumer electronics with companies like Microsoft and Kodak to modernization efforts with the U.S. Army. Demetrius is constantly thinking of new methods and tools to make user research faster, less costly, and more accurate. His training in advanced communication helps him to understand and connect with users, tapping into the experience that lies beneath the surface.  Read More

President & Co-Founder at Metric Lab

Strategic UX Adviser & Head of Business Development at 30sec.io

Redwood City, California, USA

Bryan McClainBryan is passionate about connecting with people and understanding their experiences and perspectives. Bryan co-founded Metric Lab with Demetrius Madrigal after doing research at NASA Ames Research Center for five years. While at NASA, Bryan worked on a variety of research studies, encompassing communication and human factors and interacting with hundreds of participants. As a part of his background in communication research, he received extensive training in communication methods, including certification-level training in police hostage negotiation. Bryan uses his extensive training in advanced communication methods in UX research to help ensure maximum accuracy and detail in user feedback. Bryan enjoys innovating user research methods that integrate communication skills, working with such companies as eBay, Kodak, Microsoft, and BAE Systems.  Read More

Other Columns by Demetrius Madrigal

Other Columns by Bryan McClain

Other Articles on User Research

New on UXmatters