As UX professionals, we use different diagramming tools to create a variety of diagrams that articulate our UX designs. We must share these diagrams with our collaborators and stakeholders, who may be in remote locations, to receive their feedback. Most diagramming tools are either desktop or cloud applications, with some collaboration options. Just a few tools, including Lucidchart, offer us the flexibility to work both offline and online and have video and chat collaboration features.
An online diagramming and collaboration tool, Lucidchart lets you create flowcharts, process diagrams, mindmaps, and wireframes. Because it is a cloud-based Web application, you can use Lucidchart in any leading browser on Windows or Mac OS computers. There is also a free iPad app. Free Google Chrome browser extensions for Lucidchart enable you to work in Google Docs and use Google Drive to back up Lucidchart documents. When you have no Internet connection, Lucidchart’s free Google Chrome app lets you create diagrams offline, then synchronize them later when you are again connected.
Champion Advertisement
Continue Reading…
Overview of Lucidchart Editor
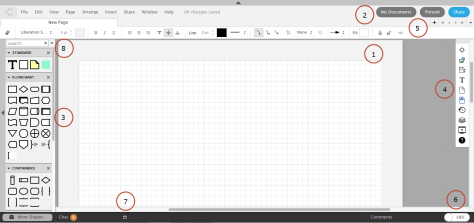
Figure 1 shows the main components of the Lucidchart Editor, which I’ve numbered. Descriptions of these components follow Figure 1.
Figure 1—Lucidchart Editor
Canvas—Drag shapes from the shape libraries in the toolbox and drop them onto the canvas.
My Documents—View a list of your files and folders.
Toolbox—Select a shape library, then add shapes to the canvas.
Dock—Use palettes on the dock to apply colors, set page positions, create master pages, view a revision history, and create layers.
Page controls—Add new pages and navigate to pages.
Comments—Add comments and respond to comments from collaborators.
Chat and video using Google Hangouts—Interact with your collaborators in real time through chat and video, using Google Hangouts inside the Lucidchart Editor.
Google image search—Search for images and icons using Google search, then drag them onto the canvas. You can either save the images or upload them to the Image Manager. View the Image Manager by pressing the I key to quickly access images across multiple projects.
Tasks That Lucidchart Supports
In this section, I’ll describe a number of tasks that UX professionals can perform using Lucidchart.
Copying Tabular Content from Google or Excel Spreadsheets
New tables in Lucidchart have a default number of rows and columns, but in most cases, when you copy content from Google or Excel spreadsheets, Lucidchart automatically adjusts the table to accommodate the correct number of rows and columns. However, when you copy merged cells from Google or Excel spreadsheets, Lucidchart inserts their content into a single table cell. The contextual panel that appears when you’re editing table cells is easy to use and offers functionality that lets you add or delete rows or columns, merge cells, or apply color to them.
Working with Visio and OmniGraffle Files
It’s easy to work with Visio and OmniGraffle files in Lucidchart. You can do the following:
Import, edit, and export Visio and OmniGraffle files. You can import any Visio or OmniGraffle document into Lucidchart, then edit it just as you would a Lucidchart document. After editing a Visio file, you can export the file in the .vdx format. For instance, once I had linked my Google Drive and Lucidchart accounts, I was able to open a .vsd file attached to an email message from my Gmail account, then import the file into my Lucidchart account. Once I’d imported the file, I was easily able to edit the .vsd file.
Import Visio stencils. Lucidchart lets you import Visio stencils in the following formats: .vss, vsx, .vssx.
View Visio and OmniGraffle files. Lucidchart offers a free viewer that lets you view Visio and OmniGraffle files in read-only mode. Users can download these free browser extensions for Google Chrome and Mozilla Firefox.
Doing Affinity Mapping
You can drag notes from the Standard shape library and drop them onto the canvas, then collaborate on grouping data or ideas.
Creating Task Flows
You can drag shapes from the Flowchart and Shape libraries and drop them onto the canvas to create task flows and user-flow diagrams.
Mapping Customer Journeys
You can use a swimlane diagram from the Container shape library to create customer journey maps.
Creating Mindmaps
Lucidchart lets you do the following when creating mindmaps:
Import and export outlines of mindmaps in .txt and .doc formats. I found it easy to import a mindmap outline. You must indent the text in an outline using tabs. Once you’ve created a mindmap in Lucidchart, you can export it as a text outline.
Use keyboard shortcuts. Lucidchart offers easy-to-remember keyboard shortcuts, including pressing the Tab key to create child nodes, Enter to create sibling nodes, the arrow keys to navigate between nodes, and the Z key to collapse child nodes.
Present a specific node and its child nodes. Select specific nodes, then create a slide using the Presentation palette in the dock. You can present the slide to collaborators and stakeholders.
Resize the canvas. Lucidchart automatically adjusts the width of the canvas when you create new nodes with the Auto-paginate option selected in Page Settings in the dock.
Move a sibling node to another parent node. It would be easier to move a sibling from one parent node to another if you could drag it from one node to the other. In Lucidchart, moving a sibling node to another parent node requires a user to delete the line that connects that sibling node to the parent node, create another parent node, then draw a line from the new parent node to the free-floating sibling node.
Create content in mindmaps. Currently, mindmaps accept only text as input. You cannot insert images into mindmaps.
Creating Wireframes
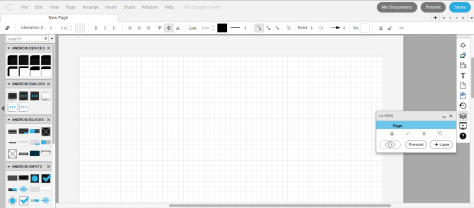
Lucidchart lets you create wireframes and mockups using different shapes from the libraries for the Web, iOS, and Android. The iOS shape library offers more than 125 design elements for devices that include iPhone 5, iPhone 6, and iPads. Figure 2 shows the Android design elements on the left and the Layers palette on the right.
Figure 2—Using Lucidchart to create a wireframe
When creating wireframes you can do the following:
Create interactions. You can define interactions by creating alternate layers on each page using the Layers panel. A page can have multiple layers. Drag a specific shape from the library and place it on a layer. You can toggle each layer on a page on or off to represent specific interactions through hotspots. On each layer, create hotspots, then assign actions to them such as show and hide layers or link to pages. You can also copy hotspots and layers from one page to another.
Create master pages. You can either create master pages and apply them to pages or create master pages from pages. You cannot create layers on master pages.
Create slides in presentation mode. To make effective presentations to stakeholders and clients, select key elements on a page, then highlight those elements to make all other content around them appear dimmed, thus emphasizing certain elements on a slide. For example, if a wireframe comprises four pages, and you need to show a client certain important content on pages 1, 2, and 4, create slides for pages 1, 2, and 4—naming each slide—then derive a final slide from the first page, taking your presentation full circle.
Collaboration and Sharing
Lucidchart lets collaborators make changes to a document in the form of notes and comments. At any point in time, it is easy to see the number of collaborators in the lower-left corner of the Lucidchart Editor. Collaborators can interact through chat or meet face-to-face by displaying video in Google Hangouts within the Editor. Unfortunately, collaboration activities are not supported on Android devices. Lucidchart lets you do the following when collaborating:
Add comments. Through comments, collaborators can share their feedback on documents. Comments that are resolved or to which you’ve replied appear in a different color. To edit or delete a comment, you must point to the comment’s time stamp. To reassign a comment, you must select another block or shape to which you want to assign the comment. If a collaborator makes a comment when the Comments option is turned off in your Editor, you’ll receive no notification of the comment.
Add notes. You can add notes to a specific block or shape. However, Lucidchart does not automatically indicate the name of the person who adds a note. This could be an important feature to have during collaboration activities.
Share documents. You can share documents with collaborators and stakeholders by sending them email invitations or links. The recipient of a link can access it multiple times, until the person who shared it chooses to delete it. Therefore, the recipient can bookmark the link. An owner of a document can share it with collaborators and assign one of four levels of permission: view, comment, edit, or owner. You can also share documents with the Lucidchart community.
Publish wireframes. You can publish wireframes as Web pages or PDFs and generate links to them. Clicking Web links lets a user view pages in Demo mode, while clicking PDF links downloads the wireframes. You can publish a single page as a PDF or as an image. When I clicked Publish Page, then selected .png as the image format and 160-DPI as the screen quality, and, finally, clicked Publish, the Publishing page notification appeared. However, once I saw this notification, I wasn’t sure what I should do next. So I read the knowledge-base article on publishing a document, but I couldn’t find the answer.
Download wireframes. You can download wireframes in .png, .jpeg, .vdx (Visio), and PDF formats. When you download a PDF with layers, hotspot areas are not highlighted visually. You must click the correct area to see the interaction.
Integrating Lucidchart with Google Docs and Google Drive
Free Google Chrome browser extensions let you integrate Lucidchart with Google Docs and Google Drive.
Using Lucidchart with Google Docs
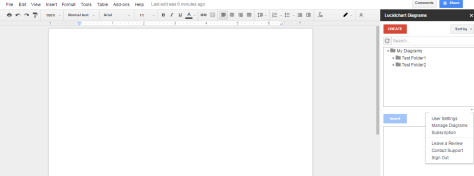
Once you’ve installed the Lucidchart Diagrams add-on to Google Chrome, you can view your diagrams in Google Docs. You must first provide your Lucidchart credentials, using the form that appears at the right of Google Docs. Once you’ve signed in, the Lucidchart Diagrams add-on appears in the same panel, displaying the list of files and folders that are linked to your Lucidchart account. Figure 3 shows the Lucidchart Diagrams add-on in Google Docs.
Figure 3—Lucidchart Diagrams add-on in Google Docs
To actually create or edit a Lucidchart document, you must use the Lucidchart Editor. Using the Lucidchart Diagrams add-on in Google Docs, click Create. The Editor appears, in which you can draw a diagram, save your changes, then close the Editor, and return to Google Docs.
When you click Save in the Lucidchart Editor, you are not prompted to change the filename, so the default filename appears in the add-on. This makes it bit hard to find the file in the list of files in the sidebar. You must select the file, then click Insert to place the file in a document.
Using Lucidchart with Google Drive
You can use Lucidchart and Google Drive to do the following:
Create new diagrams using the Lucidchart Editor.
Export diagrams to Google Drive in different file formats such as .png, .pdf, .jpeg, and .vdx (Visio).
Synchronize your Lucidchart files to Google Drive.
Create backups of Lucidchart files on a daily or weekly basis.
Lucidchart does not provide integration with Google Sheets, Slides, or Google Talk. Users must collaborate and communicate using the Lucidchart Editor if they want to attach their comments directly to the document they are creating.
Using Lucidchart Offline
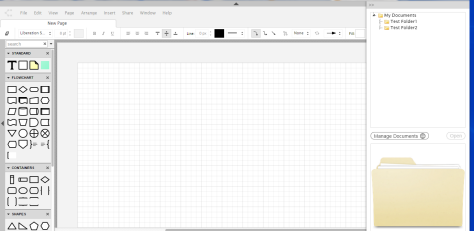
When you have no Internet connection, Lucidchart’s free app for the Google Chrome browser, shown in Figure 4, lets you create diagrams offline. Once you again have an Internet connection, it will synchronize your documents.
Figure 4—Lucidchart’s free app for Chrome
Before using the Lucidchart app for Chrome, you must synchronize all of your Lucidchart documents to your Google account. Only then can you open your Lucidchart documents offline.
It would be better to have a clearly labeled button in the upper-right corner of the screen to display the list of documents rather than <<. The hierarchical document list comprises folders and filenames. It would be helpful to be able to sort or filter the document list by date or name. The documents are simply listed in chronological order.
Support for Lucidchart
This section describes some resources that are available to Lucidchart users to ease learning and improve their user experience.
Lucidchart Training
A variety of learning aids is available to Lucidchart users, as follows:
YouTube videos of tutorials in the Editor—These video tutorials are very helpful to a first-time user who is just getting started in Lucidchart. There are two categories of tutorials: General and Advanced. Each category comprises tutorials on specific topics, which include task instructions and YouTube videos. The videos are easy to follow, but I was not able to resize the video screen. I had to click the YouTube icon in the video player to see the video in a wider format.
training videos on YouTube—Lucidchart has a very active channel of more than 150 video tutorials on YouTube. The videos are very helpful in gaining an understanding of Lucidchart’s features. However, some of the videos need updating because they depict tasks within earlier versions of the Lucidchart user interface.
knowledge-base articles—These articles are easy to understand and usually comprise task-based instructions and accompanying screenshots to help users quickly learn and apply their knowledge.
Deficiencies in the Training Materials
There are no icons to differentiate task instructions from videos. In lists of search results, only a single icon indicates whether a knowledge-base article contains only text instructions or text and video.
Search results were not as expected. On several occasions, when I searched for specific terms in the knowledge base, I did not get the results that I expected.
There is no search box on knowledge-base pages for individual articles. Once I obtained a list of search results from the Knowledge Base home page, I opened a few results in different tabs. However, because there was no search box on those pages, to search for another term, I first had to return to the Knowledge Base home page.
Labels for links to documentation pages use inconsistent terminology.
The Lucidchart Help Center is organized into three areas: Q&A, Knowledge Base, and Feature Requests.
The Documents area contains Community, Forums, and Tutorials links. The Forums link leads to the Help Center page, and the Tutorials link leads to the Knowledge Base page.
The Help menu in the Lucidchart Editor contains Help Center and Tutorials and Documentation options. The Tutorials and Documentation option leads to the Knowledge Base page.
The Lucidchart Community
Lucidchart has a thriving community Web site, which provides templates that community members have posted. You can view the templates by specific shape library categories. Users can create new diagrams based on diagrams that community members have posted.
Making Feature Requests
Users can submit new feature ideas and view the planned list of new features. You can ask to be notified via email about the latest feature requests that community members have posted.
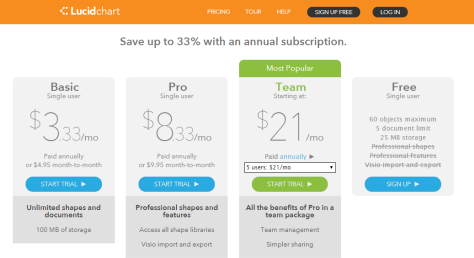
Product Pricing
As shown in Figure 5, you can obtain a free, single user account or purchase a Basic, Pro, or Team account. If a licensed Pro or Team user shares a document and grants editing permissions for it, an unlimited number of users can collaborate on that document. However, if a collaborator has a free account or is an unlicensed user on a team, that user will not have access to any premium features that the licensed user used in the document and can only view the document.
Figure 5—Lucidchart subscriptions
Accessed from Lucidchart’s Pricing page on June 1, 2015
The User Experience
Lucidchart generally provides a good user experience.
Notifications About Losing Internet Connectivity
Since Lucidchart is a cloud-based application, I occasionally experienced interruptions because of a lack of Internet activity. However, I always received notifications when this occurred, as well as when my Internet connection was restored. This has been very helpful.
A Feature Request: Zoom In and Zoom Out Controls Near the Canvas
When working on the canvas in the Lucidchart Editor, it was often necessary to navigate to different regions of the canvas. To do this, I had to display the Navigator palette in the dock, which let me move to a specific area of the canvas or zoom in or out. Placing Zoom In and Zoom Out controls near the canvas, independent of the Navigator would be helpful.
Conclusion
Lucidchart is an easy-to use, diagramming application for the Web and has a minimal learning curve. An excellent diagramming tool for UX professionals, Lucidchart offers useful features such as importing Visio and OmniGraffle files, integration with Google Docs and Google Drive, an offline mode, and excellent collaboration support through chat and video. Hopefully, Lucidchart will add support for Android and iOS devices soon. That would bring them a whole new set of users.
Many thanks to Emily Bell of Lucidchart for setting up a Lucidchart Pro trial account for me and to McKayl Bergman of Lucidchart for quickly responding to my queries.
We also have diagramming product named Creately, which you can use to create various diagrams related to UX. We also have a desktop version and a Web-based version, and you have the option of syncing them, too.
Do consider reviewing us, too. If you want a pro account set up, drop an email to [email protected], and I’ll be happy to do so.
Arun is a usability analyst who explores new ways of helping users to reach their goals. Prior to working in usability, he held technical support and technical writing roles. In addition to writing for UXmatters, Arun has written articles for Usability Interface, a quarterly newsletter of the STC Usability SIG, and is a volunteer for IxDA. Read More