By marrying the superlative power of analytics with the underlying principles of user experience, technical communicators can assess specific user behaviors that occur as users read content. As the technical communication industry evolves and goes global, technical communicators are developing content in a way that fosters increasing engagement with the user population. To accomplish this, the industry is adopting a more user-centered outlook. By leveraging analytics, technical communicators can quickly determine what information users search for most frequently and which information sets they largely disregard. To echo the words of Tristan Bishop, a senior content strategist:
“It won’t be long before you’ll know which of your topics are making a positive difference, which need some help, and which can simply disappear. It will soon be painfully obvious which team members are writing the high-impact topics, which are writing the unintelligible topics, and which are writing the irrelevant topics.”
Champion Advertisement
Continue Reading…
In this article, we’ll present some of the metrics that are most useful to technical communicators in assessing how engaging users find their content:
traffic volumes
bounce rates
keyword searches
conversion rates
For technical communicators writing user documentation, industry-standard authoring tools now incorporate powerful analytics capabilities that provide insights into how users are reading and interacting with their content. Two contemporary tools worth mentioning are MadCap Pulse and Adobe RoboHelp Server, which are server plug-ins for MadCap Flare and Adobe RoboHelp, respectively. Plus, built-in features of these tools have brought an additional level of maturity to online Help systems by adding a social layer to online documentation and fostering knowledge sharing. Some of the smarter analytics tools can present time-based heatmaps that show the effects of changes to a Web site.
In a world gone social, engaging with users is now a key requirement for technical communicators. We’re witnessing an unprecedented proliferation of user-generated content through wikis and social media. Today’s technical communicators must adopt techniques that enable them to gauge how users peruse content, regardless of the geography or culture of particular user communities. By surfacing the right insights, analytics can help companies to establish solid connections with their user community.
In this article, we’ll also describe how to integrate the power of analytics into the frameworks that provide the foundation of user documentation in the digital realm—thus, elevating our content to the next level of maturity and outpacing industry rivals in winning customer confidence. We’ll also discuss current trends in technical communication, as well as a tool set that enables technical communicators to sustainably deliver meaningful results—for example, by minimizing wait times for users to retrieve the right content.
The Social Model of Technical Communication
Traditionally, technical communication has been unidirectional and didactic, and technical communicators have produced voluminous amounts of content without engaging the user population in any substantive way. Because technical communicators have not solicited the views of users in trying to facilitate continuous improvement of their content, the democratization of content has been lacking. However, since the advent of Web 2.0, which ushered in a social model of communication, technical communicators no longer perceive this as a good working model.
The development of content is no longer limited to technical communicators. Any user can now actively contribute information, with the result that technical communicators are transitioning to roles as curators of dynamic content rather than gatekeepers controlling access to stagnant information. Over the years, users have become an integral part of content development and maintenance. Iterative feedback is vital to developing high-quality documentation. The social model of technical communication has, therefore, gone viral. The result of engaging with the user community and encouraging them to participate in conversations is an enhanced user experience and improved satisfaction with user documentation.
Embracing new processes necessitates the adoption of new technology. With the growing importance of user feedback, the technical communication industry is adopting tools and platforms that foster user involvement instead of remaining focused on traditional publishing tools. Social features—such as commenting on content—augment the interactions of myriad users spread over diverse geographical areas. (The next section, “Usage of Analytics by Technical Communicators,” provides additional insights into how you can put technology to use in capturing user interactions.)
In traditional documentation-development processes that are devoid of significant user engagement, technical communicators first plan out their documentation activities, define a content outline or structure, develop documentation based on a project schedule and their content outline, then present a first draft for internal review. Subject-matter experts (SMEs) and editors validate the content, identify any factual errors or consistencies and close knowledge gaps. Authors then update the content, addressing comments from SMEs. And, finally, the content is approved and published for the user community. With a social model of content development, this is the juncture at which users can get engaged and begin providing their feedback on the content. Empowering users to contribute their ideas in comments initiates user engagement.
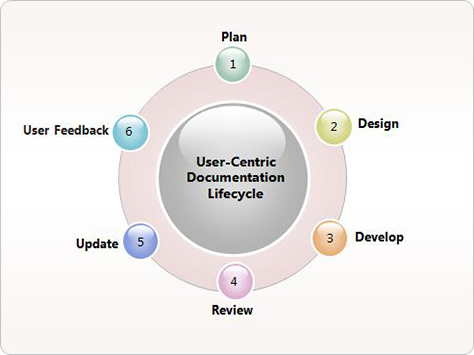
Figure 1 shows a typical, user-centered documentation lifecycle, in which obtaining feedback is integral to the process, drives continuous improvement, and focuses future planning activities.
Figure 1—A user-centered documentation lifecycle
The production of user-centric documentation remains a multistage process, but today it culminates in capturing user feedback and an effort to align the content to the expectations and needs of the users. This extended process fosters a culture of continuous improvement.
Usage of Analytics by Technical Communicators
The use of analytics offers the ability to transform data into insights and fosters better decision-making within a business. As a discipline, Analytics is responsible for the systematic, computational analysis of data and reveals meaningful patterns in that data. It uses descriptive techniques and predictive models to provide valuable knowledge based on data analysis.
Over the past several decades, the business world has had to process increasingly large quantities of data. In fact, most things people do in the digital world today involve the usage of data. Our browsers capture what we search for and the Web sites we have visited. Web sites, in turn, record the paths we take through them. When we listen to digital music on our mobile devices, our apps collect data on what we are listening to and how often. The volume of data that we’re all dealing with has invigorated the usage of analytics.
In analytics software, the data-analysis process has three distinct stages: Initially, advanced analytics algorithms filter out irrelevant information until all that remains is valuable nuggets of intelligence. Next, the software rapidly analyzes the information for patterns. Finally, it converts the analysis into insights that people can then use in determining what actions would drive optimal results. They then recommend specific actions for implementation based on these insights.
The discipline of Analytics enables technical communicators to assess how users are using online Help systems and Support services on Web sites, and thus, how they can enhance the user experience. Using analytics, technical communicators can ascertain the following key information:
traffic volumes—This entails analysis of variations in the number of people who are reading the content over a specific period of time—for example, a quarter, a month, a day—or at specific times of day. It answers questions, such as the following:
Is certain content gaining in popularity over time?
Are support calls on the wane?
Is instructional content sufficiently effective to obviate the need for users to call up the Service Desk?
bounce rates—In the context of a Help system or the Support section on a Web site, a bounce occurs whenever a user searches for a Help topic, then quickly leaves the search results without viewing or reading any content. A high bounce rate denotes either that the content does not meet the needs of the target audience, or the user who is looking for content does not belong to the part of the user population for which the content was written.
keyword searches—By using analytics, technical communicators can track the most common keywords for which users search when using an online Help system, for example. This provides insights into the types of content users need. It also helps technical communicators to ascertain whether they’ve written the content—procedures, for example—in a way that aligns with users’ expectations.
conversion rates—Users find what they need in online Help systems by traversing one page after another, until they reach a page where they complete or end their search. Thus, technical communicators can track conversions by following user journeys through series of pages that users have navigated and determining whether they found the information they needed or abandoned their search along the way. They can also track the total time that searches consume until users reach their destination or end their search.
There is other information that technical communicators can discern from analytics, including the following:
what sections users most frequently read and which they visit only sporadically
the number of new visitors versus returning visitors
geographical areas in which users choose to view certain sections
the browsers people use to access the content
There are many more such metrics that technical communicators can leverage to assess the efficacy of each section they write, as well as patterns of content consumption by users.
Analytics-Based Authoring Tools for Technical Communicators
Users do not discuss documentation unless they cannot find the information they need or cannot understand something in the documentation they are reading—that is, unless they have something to complain about. Aligning the style, content, and design of documentation to the needs of a user population requires careful consideration of users’ knowledge, experience, contexts, and culture. Thus, with the intent of creating user-centric documentation, the technical communication industry has embraced analytics to learn what users cannot find or do not understand.
Two key players in the technical communication–software market, Adobe and MadCap, have responded to these needs by integrating analytics into their authoring software and enabling technical communicators to implement social features in electronic documentation. These tools rely on an underlying analytics-driven architecture and have proven effective in capturing the terms for which users are searching and determining whether users have been successful in locating the topics they need using the search terms they have entered. By using this information, technical communicators can enhance the findability of the documentation they are creating.
MadCap Flare
Ever since the launch of MadCap Flare version 3.0 in 2007, MadCap has provided a built-in feature that enables user feedback and user comments on any of the HTML-based Help topics it generates. Flare 9 has added an on-premise server product called MadCap Pulse, which gives technical communicators the insights they need to create an engaging user experience and reduce technical-support calls. Using the analytics features of MadCap Pulse, technical communicators can gauge whether the documentation they have written has gained user acceptance, identify which parts of the documentation are most useful or could potentially be enhanced, and what might be missing from the documentation.
MadCap Pulse allows users to provide feedback by rating each Help topic and, thus, contribute to content quality. Some of the latest new features of MadCap Pulse include the following:
subscription to content-related activities—Subscribing to content requires only a single click and allows users to subscribe to feeds and topics.
moderation of comments—A moderator can accept or decline user posts or comments. The software distributes a list of all outstanding user posts that require a moderator’s attention via email.
sharing files with groups—Users can share documents, images, videos, and links with others in the user community and, in the comment stream, associate them with topics.
RoboHelp Server
Adobe released RoboHelp Server to track and analyze navigation, usage patterns, and search queries for documentation and support the optimization of Help content. Some features of RoboHelp Server that deserve mention are the following:
versatile, feedback-oriented reports—The tool comes with many built-in reports such as Page Views, Pages per Visit, Search Trends, and Frequently Viewed Content.
data export to the .CSV format—You can export metrics in the comma-separated values (.CSV) format, then use them during statistical analysis.
sharing comments—Users can share comments on a RoboHelp Server or at a shared-network location and accept, decline, or delete them.
In Summary
Technical communicators are now harnessing the combined power of analytics and the principles of user experience to assess specific user behaviors and ensure continuous improvement of their content. In an era when user engagement plays a pivotal role in determining the quality and coverage of content, there is consistent demand for audience-centric user documentation. Utilizing analytics to their fullest potential helps technical communicators to understand the needs of users and align their content to users’ evolving needs. The ability of analytics tools to rapidly analyze data and discern patterns in it eliminates the need for human intervention in analyzing and understanding what users need. Thus, refining our content is an ongoing process whose goal is meeting user expectations.
Well-written and comprehensive article. It’s important to realize, for us technical writers, that in the emerging model, almost everyone is a technical communicator in one sense or another. I am reminded of an insightful article by Mark Baker in this context. Still, I think the social model has some interesting challenges:
How much democratization of content are you going to allow? Allowing everyone to contribute can potentially lead to a lot of irrelevant content. Distinguishing useful content could be a potential time-waster. I think there should be an entry barrier.
While I am sure that the analytics will be extremely useful, the basic challenge still stays: getting people to read content or visit Help systems. That, I believe, is the first step. User story or use case-based documentation could be worth looking at.
Questions: Aren’t the costs and licensing of these tools a bit prohibitive, making them part of a kind of elitist club? Are there relatively low-cost options available for smaller companies and startups, who have tight purses?
Senior Manager, Learning and Content Services, at Cognizant Technology Solutions
Kolkata, West Bengal, India
With more than 15 years of experience in technical communication, Debarshi has developed documentation for a wide variety of business domains, including Banking and Financial Services, Insurance, Healthcare, Travel and Hospitality, and Oracle’s Siebel systems. He has also developed training materials, including simulations, and worked in the Web content space. Debarshi has extensive project and program-management experience, both onshore and offshore; has led diverse teams across geographical locations; and has worked directly with clients. Publications that have published his articles on technical communication include UXmatters; Usability Interface, a quarterly publication of the STC Usability and User Experience Community; TCWorld; and Indus, a bimonthly publication of the India Chapter of STC. Read More
As an experienced technical writer, Samiksha has skillfully developed comprehensive documentation across diverse industries, including service and operations management, telecommunications, media and entertainment, banking and financial services, and healthcare. With a Master’s degree in Computer Science, Samiksha not only possesses a deep understanding of technology but also possesses the ability to effectively communicate intricate details to both technical and nontechnical stakeholders. Beyond her professional endeavors, Samiksha is an avid trekker and passionate traveller, seeking adventure and exploring new horizons whenever possible. Read More