Top

Revisiting the Pile-Sort Method of User Research

December 8, 2014

The UX community has a long acquaintance with the pile-sort method of user research. In this article, we’ll revisit the origin of the pile-sort method in anthropology and provide an account of how we used this method to understand user task flows. We’ll also introduce an extension to the pile-sort method that helped us to collect user data more effectively while working in an agile software-development environment. Finally, we’ll discuss the analytical method that we used to process our study results: factor analysis.

Champion Advertisement
Continue Reading…

A Brief History of the Pile-Sort Method

Michael Burton [1] first introduced the pile-sort method to anthropology in 1975 as a method of collecting data about “what goes with what.” In his study, Burton asked 108 high-school students to group the names of 58 American-English terms for roles in whatever groups they felt belong together. The same study later introduced factor analysis to create a mental map of role associations the study participants made. In the social sciences, pile sorting and factor analysis have since become a common combination of research methods for exploring people’s mental maps of the terms used within a particular cultural domain.

Here is one example of the usage pile sorting and factor analysis in anthropological research. Susan Weller [2] asked 20 urban, Guatemalan women to list all of the illnesses they could think of. Subsequently, she compiled a list of  the 27 illnesses they named most frequently, put each of them on a card, and asked 24 other women to sort the cards into piles according to similarity. Figure 1 shows the factor-analysis results for Weller’s pile-sort data, using a multidimensional scaling (MDS) graph. The graph visually plots the illnesses that the study participants regarded as similar. For example, there is a clump of gastrointestinal disorders in the upper-right corner and a clump of childhood disorders in the upper-left corner.

Figure 1—MDS graph showing a mental map of 27 illnesses
MDS graph showing a mental map of 27 illnesses

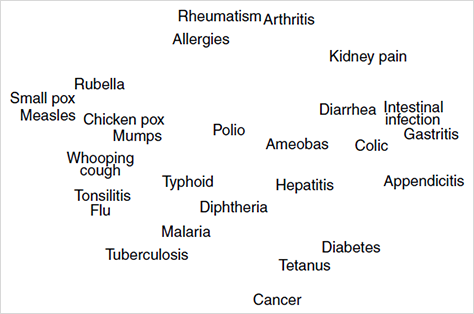
Source: Susan C. Weller. “New Data on Intracultural Variability: The Hot-Cold Concept of Medicine and Illness.” Human Organization, Volume 42, Issue 3, 1983.

Determining User Task Flows and Contexts of Use

One common deliverable from user-research activities is the user task flow, which maps out a sequence of tasks that users need to perform using a product that a team is designing. Recently, while working on a mobile application for events, we encountered a situation in which the design team already had comprehensive knowledge about how people would prepare to attend an event. However, this information was scattered among individual team members and embedded in discrete artifacts. Team consensus was lacking. We decided to work with the design team to gather all of the available information, then use the pile-sort method to create a task flow comprising all of the steps that users would take in preparing to attend an event.

The design team was working in an agile environment. While preparing for the pile-sort study, the designers realized they needed to answer another, probably less straightforward question that was a matter of deep concern to them: “How will our product support users at each stage of their tasks?”

We believed that the answer to this question resided somewhere within the context in which the users were performing the tasks. While user context is a difficult term to define, for the purpose of our work, we considered context within the scope of the following questions:

  • What other, concurrent tasks is the user performing?
  • How does the surrounding environment permit or inhibit the performance of the user’s tasks?
  • What kind and degree of sentiment do users attach to the various tasks?

We searched our toolbox for an appropriate tool that would complement the pile-sort method and help us to accomplish our task of understanding contexts of use, but did not manage to find one. We had sought inspiration from practices in anthropology—more specifically, from the area of cultural domain analysis, in which field researchers often need to discover the mental maps of people within particular cultural domains. This goal strongly resonated with ours, which was to discover contexts of product usage by mapping out the associations that users make between their tasks and the contexts of their surrounding environment.

Our Study’s Setup and Procedure

To understand what activities a user task flow would comprise and what objects people associate with each activity in the task flow, we prepared 57 information cards, shown in Figure 2. Each card contained information belonging to one of the following three categories:

  • user activities—25 green cards
  • artifacts—26 blue cards
  • attitudes—6 red cards
Figure 2—Information cards prior to a study session
Information cards prior to a study session

Our study included 12 participants of mixed gender, age, and ethnicity. Each study session involved one participant, a moderator who ran the study, and a note taker who captured participants’ comments on a laptop computer. Each session took approximately 30 minutes.

We divided each session into two steps. During the first step, we invited a participant to arrange the green information cards for user activities into a timeline, from the activity’s starting point to its end point. To avoid any potential priming effect, we randomized the pile of green information cards before presenting them to each participant. Study participants sorted the cards into a timeline, leaving out any of the cards for activities that were not relevant to them.

We employed an extended pile-sort method during each session’s second step. The timeline in which participants had placed the green activity cards during the first step served as the seed for the second step, during which participants assigned artifacts and attitudes to related activities. Participants placed blue artifact cards and red attitude cards around green activity cards. Thus, the results from first step predetermined the number of piles into which participants could sort the rest of information cards.

Figure 3 shows an example outcome from the first and second steps of a session. During the first step, the participant had laid out cards representing concurrent activities in a timeline, in parallel to each other, as shown on the left in Figure 3. During the second step, the participant represented an association between artifacts or attitudes and activities by placing red and blue cards next to green cards, as shown on the right.

Figure 3—An example timeline from one study session
An example timeline from one study session

Based on the associations that participants represented between artifacts or attitudes and activities, we performed weight assignment and factor analysis in later steps.

Aggregating User Task Flows

To aggregate the pile-sort results from individual participants, we first assigned a weight to each green card from step 1, with the first instance having a value of 1 and each subsequent instance increasing the weight by 1. The weight scores from different study participants varied greatly as a reflection of individual differences between them. Some participants organized events for friends and, thus, created long task flows, while others had many fewer tasks to perform in preparing to attend an event. Simply aggregating the raw weight scores would have biased the results toward those of participants with longer task flows. To overcome this issue during data preparation, we performed the first round of normalization, dividing each weight score by the largest weight from an individual, giving a score to relative weight values, ranging from 0 to 1

Aggregating the relative weight values from all participants gave us a clear picture of the position of each task in the overall workflow. However, as we observed later during analysis, participants selected some tasks more often than others. So, simply aggregating the relative weight scores from our first round of normalization would again have given a biased outcome—in this case, biased toward those tasks that participants selected more often. We resolved this concern through a second step of normalization, dividing each score in the aggregated list by the frequency of a task’s selection by participants.

Estimating the Contexts of Use Using MDS Analysis

To get a glimpse into the contexts of use for each task stage, we performed a multidimensional scaling (MDS) analysis on the data from the second step in our study, during which participants associated cards representing activities, artifacts, and attitudes with tasks.

Similar to Weller’s 1983 study, we calculated a proximity matrix by counting the number of times participants associated the two blue artifact cards with one green activity card, then aggregated the results from individual participants to produce an association map. The resulting MDS graph, shown in Figure 4, clusters the activities, artifacts, and attitudes our participants associated with each task into four major groups that we labeled Event Discovery, Learn Event Details, Coordination, and Go to Event. By investigating the contents of each group, we were able to understand the context of use at each stage of a task. This understanding laid the groundwork for more comprehensive studies on the stages of a task that the product team chose to focus on.

Figure 4—MDS graph of associations among information objects relating to user tasks
MDS graph of associations among information objects relating to user tasks

Conclusion and Future Improvements to Our Study Design

In this article, we have summarized our experience using the pile-sort method to study user task flows and described how we extended this method to accommodate particular project requirements when working in an agile environment. We hope that our approaches to research and analysis will benefit other UX professionals.

As we reflect on the research design for this particular study, we would also like to share our concerns about the study design—especially those regarding its robustness. In the second step of our study, during which we asked participants to associate information objects with tasks, we, in essence, set up a seeded version of the pile-sort method. The number of seeds—which participants determined during the first step of our study—has the potential to dilute participants’ responses. In other words, because we asked participants to group information into many piles, it was only by aggregating the responses from a larger number of participants that we could gain a reasonable understanding of the context of a particular task stage.

Finally, even though our study was quantitative in nature, the interpretation of its results in the multidimensional scaling (MDS) graph was subjective. We found a team brainstorming session beneficial to drawing conclusions from the data. 

Project Officer at Nanyang Technological University

Singapore, Singapore

Khasfariyati RazikinKhasfariyati is currently pursuing a PhD in Information Studies at Wee Kim Wee School of Communication and Information and is a Research Trainee at SAP Asia Pte Ltd. The focus of her study is on using UX design to induce behavior change for better health and personal well-being. Her past work centered on understanding user experience, as well as the design and implementation of Web and mobile social-computing applications. Khasfariyati has co-authored papers that were published in international conference proceedings and journals. She graduated from Nanyang Technological University, with a Master’s of Science (Information Systems) and a Bachelor’s of Engineering (Computer Engineering).  Read More

User Experience Researcher at SAP Research and Innovation

Singapore, Singapore

Hang GuoHang’s work focuses on understanding users and their interactions with digital artifacts within enterprise settings. He has a Master’s degree in Human-Computer Interaction from the University of Michigan at Ann Arbor.  Read More

Cyber Security Consultant

Singapore, Singapore

Muhammad HatibMuhammad is currently pursuing his undergraduate study in Information Systems Technology and Design at SUTD. He recently joined SAP Research as an intern.  Read More

Other Articles on Card Sorts

New on UXmatters