Top

Business-Value Metrics for Field Studies

February 11, 2014

Demonstrating business value is a continual challenge for the UX community, as Lis Hubert and Paul Callee noted in their recent series of articles on UXmatters. I’d like to contribute to the discussion about business value by presenting a case study that offers hard numbers on the business value of field studies:

  • a 50% reduction in project scope as a direct result of doing field studies
  • a 300% return on investment (ROI) for the time UX researchers spent on field studies

If you’re interested in learning more about the business value that field studies provide, read on.

Champion Advertisement
Continue Reading…

A Case Study

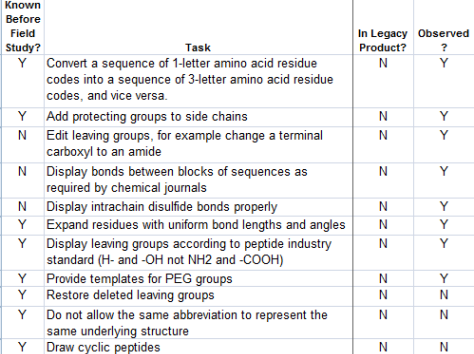
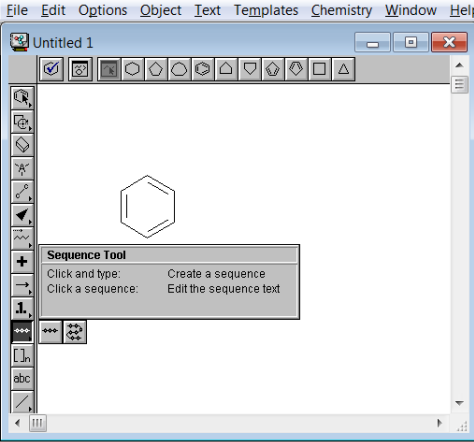
A developer of drawing and database software for chemists needed to replace a legacy drawing tool from 1996 with a second-generation product that used more advanced technology. One feature of the legacy product was a tool palette with two specialized drawing tools—the Sequence Tool and Sequence Shape Tool, shown in Figure 1. A small minority of chemists used these tools to represent protein structures as sequences of single-letter, amino-acid codes.

Figure 1—Legacy product with specialized drawing tools for protein structures
Legacy product with specialized drawing tools for protein structures

Because the market for this product was so small, the company could’t justify spending large amounts of resources on implementing these tools in the new product. To reduce the scope of the product release while still meeting users’ needs, we needed to find out which features were most important to chemists and ensure that those features got implemented in the new product. We decided to do field studies to provide the answers.

Our Research Methodology

Four of the ten members of the product team participated in the field studies:

  • 2 marketing people
  • 1 developer—the lead developer for the product
  • 1 technical writer—the author of this article

Our team made two visits to a customer site. On the first visit, our goal was to observe chemists as they used the legacy tool, note where they had problems, and ask questions when they did something we didn’t understand. To interview as many people as possible, we organized into two-person teams consisting of one marketing person and one developer or technical writer, and in this way, we managed to observe over a dozen chemists at work. A year later, we spent another week at the same site conducting usability testing on the beta release of the tool.

As the technical writer on the team, I not only interviewed users at the customer site, but transcribed our notes from the study into a detailed, 20-page report that showed exactly what customers were trying to do and why they were doing it.

Improvements Resulting from the Field Studies

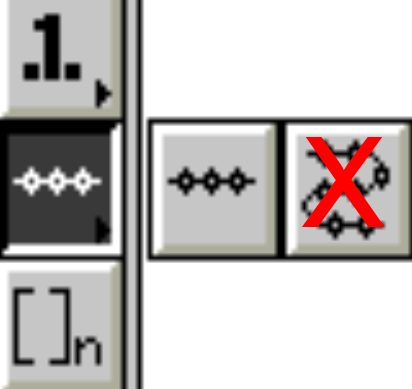
Our research showed that the legacy product was cluttered with features that the chemists never used. For example, users had no use for the Shape Tool.

Figure 2—Shape Tool eliminated
Shape Tool eliminated

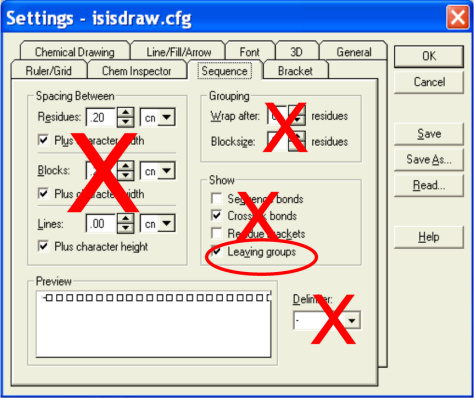
We discovered that the Leaving groups check box in the Settings dialog box, shown in Figure 3, was the only option that the chemists actually used, making the remaining twelve controls unnecessary.

Figure 3—12 of 13 controls eliminated
12 of 13 controls eliminated

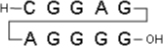
In addition to eliminating unnecessary features, we also saw that the legacy product lacked direct support for fully one-third of the most common user tasks. The product team had been completely unaware of three of the missing tasks before the study. For example, we discovered that it was extremely important to chemists to be able to represent chemical structures using the standards that chemical journals required, as shown in Figure 4.

Figure 4—Displaying the standard chemical structure for chemical journals
Displaying the standard chemical structure for chemical journals

The legacy product provided two display options for chemical structures, neither of which fit the standard, as Figure 5 shows.

Figure 5—Available display options in the legacy product
Available display options in the legacy product

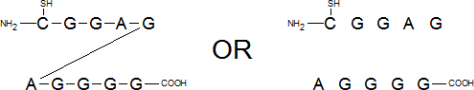
This feature was so important to the chemists that the system administrator had created a custom application to provide the necessary display. Without our field study, we might have dismissed the requirement for this feature as “only cosmetic” and eliminated it from the release!

Calculation of Metrics

It’s all very well and good to show how field studies helped to eliminate unwanted features and discover users’ unmet needs. But can we quantify that? Let’s return to the two metrics that I mentioned earlier: The 50% reduction in scope and the 300% return on investment.

Scope Reduction

Before we conducted our study, the marketing department had identified 61 user tasks that they thought the product should support. Expressed in users’ terminology, each task represented something that users would want to accomplish.

I entered all of the tasks into a spreadsheet and added three columns to indicate which tasks we had known about before our field study, which tasks the legacy product supported, and which tasks we observed at the customer site. Figure 6 shows part of this spreadsheet.

Figure 6—Spreadsheet of chemists’ tasks
Spreadsheet of chemists’ tasks

The study had revealed three tasks that we hand’t previously known about, indicated by N in the Known Before Field Study? column. Our discoveries raised the total number of tasks to 64. We knew, however, that chemists performed only 27 of these tasks every day, as indicated by a Y in the Observed column. Our field study had demonstrated that we could omit as many as 37 of the 64 tasks, for a scope reduction of over 50%.

Return on Investment

The Sequence Tool wans’t the only project the product team was working on at that time. We were also working on two enhancement releases of the new chemical drawing program. As the technical writer on the product team, I was responsible for user research and documentation for the entire product, not just the Sequence Tool. To show the value of the UX research I had done, I tracked the time I spent on the Sequence Tool separately from the work I did on the rest of the product. When I added up my time, I found that I had spent a total of 17 weeks on the projects, allocating my time as follows:

  • 4 weeks conducting user research for the Sequence Tool—This included 2 weeks of customer site visits and 2 weeks for report writing.
  • 13 weeks on product documentation—In addition to the time I spent producing customer-facing documentation, this includes the time I spent in design meetings and doing in-house usability testing.

If we had not been able to cut the project scope in half, I would have spent at least twice as much time on product documentation—a total of 26 weeks. The 4 weeks I spent on research eliminated 13 weeks of unnecessary work on documentation, for an ROI of over 300%—13 weeks versus 4 weeks.

These cost savings are a conservative estimate because I was tracking only my own time. My figures don’t include the time the nine other members of the product team saved because they didn’t need to program, test, or fix bugs in the features that users did not need.

A Final Word

I hope that this case study will stimulate more discussion of metrics in the UX community. I look forward to hearing from other UX professionals about their use of metrics. 

Senior Information Developer at BD Biosciences

San Jose, California, USA

Nicki L. DavisNicki became interested in user experience when studying for her PhD in chemistry. To her dismay, she discovered that it took six months to learn how to use the analytical instrument she needed for her thesis work. To improve the usability of the instrument for herself and her fellow graduate students, she revamped the user assistance for the instrument, writing a task-oriented user manual. Since then, she has pursued her goal of making technology easier to use by whatever means are appropriate to the task, whether It’s user-centered design, user research, or technical communication.  Read More

Other Articles on User Research

New on UXmatters