The third annual Enterprise UX (EUX) conference opened on Wednesday, June 7, 2017, when a day of workshops convened at the Argonaut Hotel, which is located in the San Francisco Maritime National Historical Park at Fisherman’s Wharf. The main conference took place Thursday, June 8, through Friday, June 9, at the Innovation Hangar in the Palace of Fine Arts in San Francisco’s Marina District.
Overall, Rosenfeld Media, the producer of this event, delivered a well thought out conference experience, with excellent content. I’m glad the organizers made attending EUX easy for me this year by moving the conference from San Antonio to San Francisco, which is a great city to visit. In recent years, one of my design goals has been the consumerization of enterprise software, so it was high time I attended this conference. Now that I have, I’m sorry I missed the first two.
Champion Advertisement
Continue Reading…
The EUX Web site poses the question: “Why Enterprise UX?” Here’s Rosenfeld Media’s answer:
“Enterprises—huge, distributed, complex businesses, government agencies, and other large organizations—account for an enormous portion of the global economy. Yet people who engage with enterprises—employees, customers, and managers—face experiences that are tedious, fragmented, complicated, and just plain awful, especially when compared with consumer-facing experiences. It’s time to right these wrongs.”
In Part 1, I’ll review the conference experience, as follows:
Organization
Content and Presenters
Proceedings
Venue
Hospitality and Events
Community
Tutorials
Later in this first part of our EUX 2017 review, Jim Nieters and I will cover each of the workshops we attended on Wednesday, June 7. Then, in Parts 2 and 3, we’ll review the conference sessions.
Organization
Organization
Content
Presenters
Proceedings
Venue
Hospitality
Community
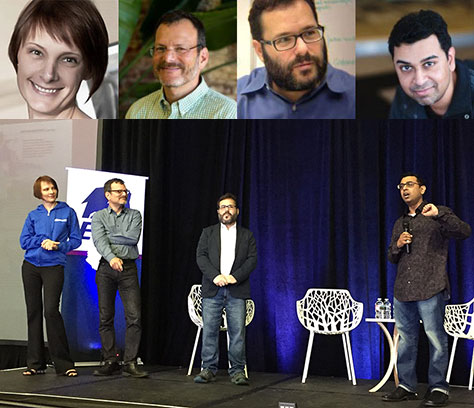
As for the 2015 and 2016 EUX conferences, Uday Gajendar, Design Lead at PayPal, and Dave Malouf, then Director of Product Design at DigitalOcean, served with Rosenfeld Media’s Lou Rosenfeld on the Program Committee. This year, Lada Gorlenko, Director of UX Research at Smartsheet, joined the programming effort. The outcome was a perfect balance of male and female speakers, which was a significant improvement over the first two EUX conferences. EUX 2017 was a well-planned, well-organized event. Figure 1 shows the Program Committee onstage, as well as headshots of Lada, Lou, Dave, and Uday, from left to right. They shared hosting duties during the conference.
Figure 1—EUX 2017 Program Committee
This single-track conference was organized into four themes:
Crafting Enterprise Experiences—“The enterprise setting forces us to redefine what good design means. We’ll explore how unique factors like complexity, scale, and lack of control can impact our craft and completely change our expectations.”
Leading Teams That Execute—“Design leaders need to do more than hire, train, and mentor great craftspeople. They must get people to work together as an interdisciplinary team, bound by a shared vision of what a successful enterprise experience can be. We’ll explore how successful enterprise UX teams work to create, own, and execute their visions.”
Transcending Silos—“Our work impacts other partners within our organizations, and our success depends on them as much as [their success depends on us]. To operationalize [User Experience] throughout the enterprise, you’ll need to have tough conversations with stakeholders in [Human Resources (HR), Information Technology (IT)], and other critical areas. We’ll explore ways to collaborate across silos, set expectations, establish shared goals, and raise the value of design throughout the enterprise.”
Creating a Legacy—“What factors ensure the growth and sustainability of enterprise [User Experience]—or indicate trouble ahead? How can we inoculate ourselves against factors that kill enterprise UX teams and practices? How do we craft a multidecade vision for ourselves and our organization that inspires followership and undying respect? We’ll learn from leaders who’ve been around long enough to tell great stories and teach valuable lessons of what makes or breaks an enterprise’s UX capabilities over the long haul.”
This was a well-paced conference, with half-hour morning and afternoon breaks each day. Everyone shared the same conference experience, which fostered good discussions during those breaks.
Content and Presenters
The conference kicked off and closed with an hour-long keynote address—from Elizabeth Churchill, Director of User Experience at Google, and Mark Templeton, formerly President and CEO at Citrix Systems, respectively.
Each morning and afternoon of the two-day conference covered a different theme, each of which had a theme leader who wrapped things up with a discussion, as follows:
Crafting Enterprise Experiences—The theme leader was Theresa Neil, owner of Strategy + Design.
Leading Teams That Execute—Phillip Hunter, Head of UX for Amazon Alexa Skills, was the leader for this theme.
Transcending Silos—The leader for this theme was Toby Haug, Head of Design & the Co-Innovation Center, EMEA, at SAP.
Creating a Legacy—The theme leader was Colette Vardeman, Executive Director of Design at USAA.
The Program Committee tailored the content to an audience comprising “people who care about delivering great enterprise experiences—whether they work within an enterprise or for an enterprise software vendor.” They broadly defined this audience to encompass UX professionals—including designers, researchers, and team leaders—product managers, developers, marketers, and other “decision makers whose organizations stand to benefit when their employees and customers enjoy better experiences.”
Proceedings
The organizers provided the conference’s complete schedule in a combination badge / program booklet. The badge information was duplicated on both covers, so always oriented for easy reading by others, while the program information was printed upside down relative to the badge. So the wearer didn’t have to flip the booklet over, but could just pick it up to read it. Plus, in the “Program” and “Speakers” sections of the EUX 2017 Web site, Rosenfeld Media provided detailed information about the conference, including special events.
Rosenfeld Media is preserving absolutely complete historical information for EUX 2015, 2016, and 2017 on its Web site. After each event, they’ve added links to slide decks on SlideShare, videos on YouTube, and sketch notes for many sessions on the conference’s “Program” page. This is a generous offering for attendees who want to refresh their memory about certain sessions—even more so for people weren’t able to attend EUX.
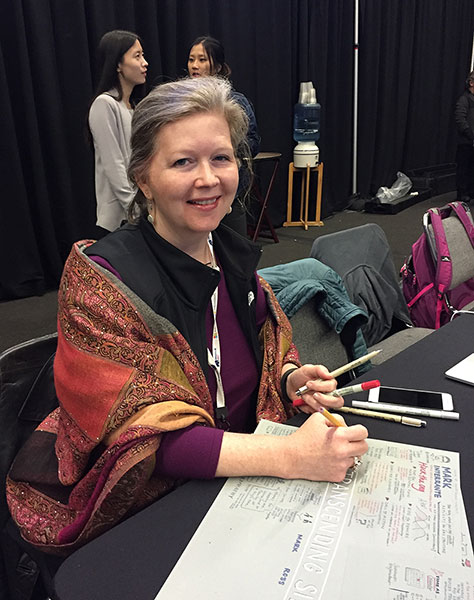
Throughout the conference, sketchnoter MJ Broadbent captured the essence of the presentations in her fabulous sketchnotes, as shown in Figure 2.
Figure 2—Sketchnoter MJ Broadbent
Venues
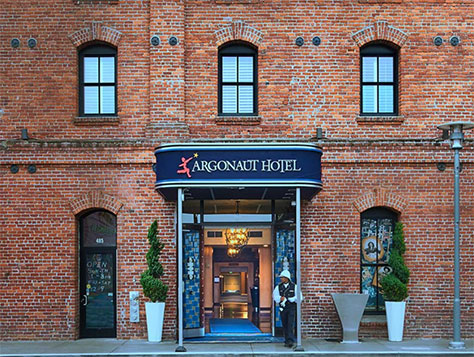
The Argonaut Hotel—a nautical-themed boutique hotel—is located in a converted warehouse building that was originally built in the early 1900s and was both the conference hotel and the venue for the conference workshops and is shown in Figure 3. Some of the rooms housing the workshops were more commodious than others, but they were all quiet, well-lit, aesthetically pleasing spaces that were conducive to learning. The Argonaut earned the stars I allotted to the venues in my rating, even though it was not the main venue. The Blue Mermaid Restaurant, hotel bar, patio, and other public spaces in this comfortable, well-designed hotel provided an environment that encouraged socializing with other conference-goers.
The main conference took place within the concrete expanse of the Innovation Hangar, shown in Figure 4, within the beautiful setting of the Palace of Fine Arts, shown in Figure 5, which is in San Francisco’s Marina District and was originally constructed in 1915 for the Panama-Pacific Exposition. The cold, drafty interior environment of the Innovation Hangar stood in stark contrast to the lovely landscape of the Palace of Fine Arts, with its colonnades and central rotunda partially surrounding a small artificial lagoon that attracts swans, shown in Figure 6, ducks, geese, and other waterfowl, as well as street musicians and tourists. I enjoyed hanging out around the lagoon.
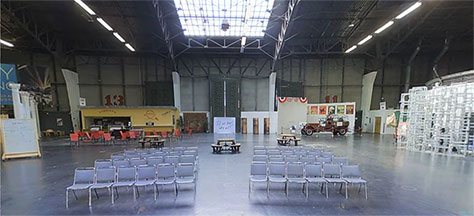
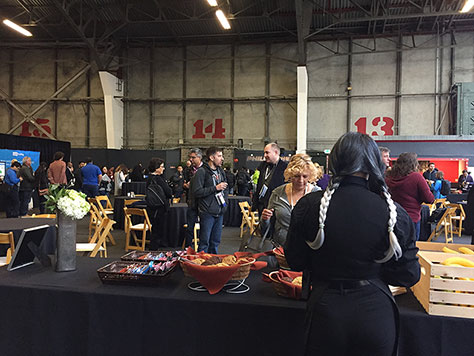
Just inside the main entrance of the Innovation Hangar, a massive open area housed the registration desk and the booths of the conference’s sponsors, as well as an area for dining and discussions, shown in Figure 7, where refreshments were served throughout the day. The open layout of this space ensured good traffic flows throughout the venue.
Figure 7—Attendees hanging out in the dining area
Unfortunately, only two days before the conference began, the Innovation Hangar announced its impending closing, citing “the financial strain of leasing space.” The house audio/video systems clearly were not well maintained during this period and caused problems throughout much of the first day of the conference. The venue’s staff struggled to remedy these problems.
In addition to the audio/video issues, the other big deficiency of this venue was its lack of comfort. Nevertheless, the big, curtained-off space within which the conference sessions were presented did ensure that everyone had seat with a clear view of the stage and the two large screens on either side of it.
I commuted into San Francisco daily for the conference, but I’ve stayed at the Argonaut Hotel before. The rooms are spacious and very comfortable, making this an excellent choice for the conference hotel.
Hospitality and Events
On Wednesday, June 7, our day at the Argonaut Hotel began with an early breakfast before the workshops started. A delicious lunch was served on the patio shown in Figure 8. During the main conference on Thursday and Friday, June 8–June 9, at the Innovation Hangar, each day attendees enjoyed a continental breakfast, refreshments at morning and afternoon breaks, as shown in Figure 7, and a buffet lunch.
Rosenfeld Media did a great job of sustaining the conference’s social milieu throughout both day and night and offered a variety of events to keep attendees entertained during the conference, as follows:
Wednesday, June 7:
San Francisco Architecture Walking Tour with Jorge Arango—Information architect, Information Architecture: For the Web and Beyond coauthor, and Futuredraft partner Jorge Arango served as the guide for this afternoon tour of downtown San Francisco’s architecture. During the tour, he looked at the city as an information environment and considered how people form mental models of urban environments. I was very sorry to discover that this tour was scheduled against the workshop I’d committed to attending. Next time, I hope Jorge does the tour again, but later in the day, at a time when there are no conflicts.
Happy Hour at the Dorian—At the end of the day, EUX served complimentary cocktails and appetizers at this restaurant on trendy Chestnut Street.
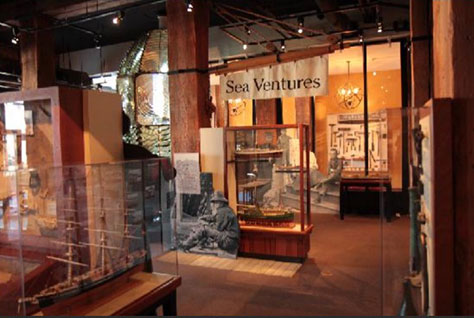
EUX17 Speaker-Sponsor Reception—Later in the evening, UXmatters attended a reception for the speakers and sponsors at the San Francisco Maritime National Historical Park’s Visitors Center on the ground floor of the Argonaut Hotel, where some of the park’s exhibits are on display, as shown in Figure 9, including the magnificent Fresnel lighthouse lens, shown in Figure 10. Hors d’oeuvres and drinks were served.
Thursday, June 8:
Opening Reception—Immediately following the Enterprise Storytelling Sessions at the end of Day 1 of the conference, this reception took place in the open area of the Innovation Hangar amidst the sponsors’ booths. Refreshments were served.
Friday, June 9:
Round-table Discussions—At lunch, attendees with common interests gathered for round-table discussions.
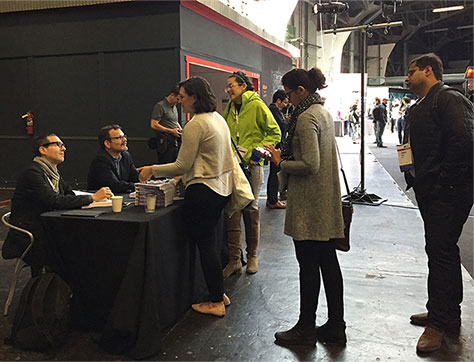
Book Signing—During the lunch break, Lou Rosenfeld and Jorge Arango signed copies of their book Information Architecture: For the Web and Beyond for attendees, as shown in Figure 11.
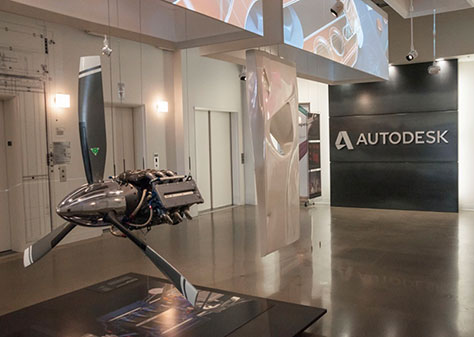
Closing Party at Autodesk Gallery—After Day 2 of the conference had concluded, conference attendees segued to the beautiful Autodesk Gallery for the best conference party I’ve ever attended. The gallery, shown in Figure 12, features the artistic works of Autodesk’s diverse customers, and there were many fascinating exhibits to explore. The conference organizers had also invited many leading lights of the local UX community to attend the party. It was great reconnecting with everyone. The crowd enjoyed fabulous food and drinks.
Karaoke—For those who weren’t ready for their EUX 2017 experience to end or just hadn’t yet had enough partying, vans transported us to the Encore Karaoke Lounge on Nob Hill. We sang, danced, and mixed with local karaoke singers till the wee hours of the morning.
Figure 9—SF Maritime National Historical Park’s Visitors Center
The sense of community at this conference is reminiscent of that at the IA Summit, of which Lou Rosenfeld was one of the organizers in its early years. That is to say, the organizers did a great job of fostering community. Of course, the conference’s focus on enterprise user experience brought together a community with a common cause. Plus, the well thought out social events each evening ensured that no one had to spend that time on their own.
Almost all of the speakers were UX professionals—many of them in leadership roles or working as consultants.
Workshops at the Argonaut Hotel
Four full-day workshops took place at the Argonaut Hotel on Wednesday, June 7, from 8:30am–4:30pm, as follows:
“Scalable Design Systems”—Nathan Curtis, Founder at EightShapes
“Product Management for UX People”—Laura Klein, Principal at UsersKnow, and Kate Rutter, Principal at Intelleto
“Design Your Design Organization”—Peter Merholz, VP of Design at Snagajob, and Kristin Skinner, Managing Director at Adaptive Path
“Strategy for Design Leadership”—Dave Malouf, Director of Product Design at Digital Ocean
I had recently attended Peter Merholz and Kristin Skinner’s tutorial “Org Design for Design Orgs” at O’Reilly Design Conference 2017, so I chose to review Laura Klein and Kate Rutter’s workshop, “Product Management for UX People,” while Jim Nieters decided to review Dave Malouf’s workshop “Strategy for Design Leadership.”
Product Management for UX People
Reviewer: Pabini Gabriel-Petit
Presenters: Laura Klein and Kate Rutter
The goal of this workshop was “to help [us] explore ways to improve the products [we] build by knowing how Product Management and User Experience connect.” The agenda for the day covered the following topics:
Who does what?
Know your business.
Know your customers.
Measure success.
Find features.
Who Does What—and What Do You Do?
This part of the workshop covered the roles of UX designers and product managers. The presentation included several graphs of top tasks from research results that Laura Klein has published on the Rosenfeld Media site, “Product Teams: Who Does What?” In the graph “Top Designer Tasks,” I found the emphasis on visual-design tasks of one kind and another—four of five tasks—rather disturbing within the context of UX design. This made me wonder whether people who I wouldn’t consider to be UX designers were being called UX designers. Only 69% of respondents included interaction design among their top tasks. In my opinion, if interaction design—which is a foundational skill for a UX designer—isn’t one of a designer’s top tasks that designer is not a UX designer. The other skill I consider to be a core skill is user-centered design, which wasn’t even mentioned among the outlier tasks. We need to define UX design more explicitly.
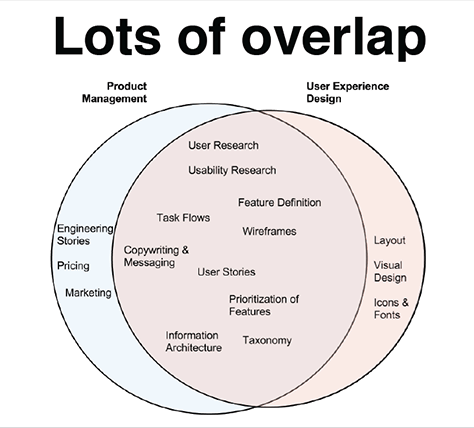
A graph of top Product Management tasks included roadmaps, product planning, feature prioritization, feature signoff, and backlog management. As Figure 13 shows, there is a lof of overlap between Product Management and UX design tasks. According to Laura’s research, “Nobody knows what to expect from us. Nobody reallyknows who does user research.” Kate asked us to spend five minutes considering all the things we do, placing them on a four-square chart that mapped their importance and how much time we spend on them, then two minutes discussing our chart with our neighbor.
Figure 13—Product Management and UX design tasks
Know Your Business
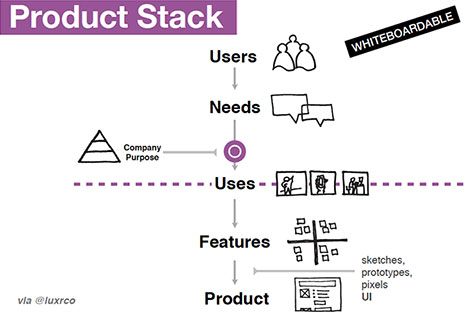
Kate shared the product stack in Figure 14, showing the nexus of a company’s purpose within it. “Knowing your business means knowing how not to go out of business. Budgeting predicts where a company is going in the future—its priorities,” said Kate.
Figure 14—Product stack
“Accrue answers and validate them as evidence emerges. What you know should be based on evidence,” advised Kate. “Something weird is happening in the Product Management world. They’re giving up roadmapping. That’s scary.”
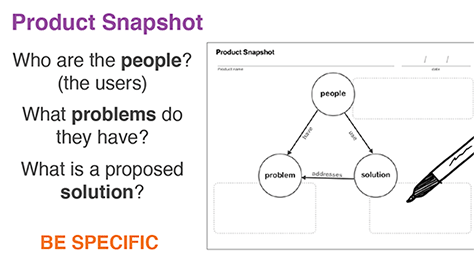
We were asked to “pick an idea to use for the day—a new feature for a product you are working on or an Amazon feature,” then spend five minutes creating a product snapshot like that shown in Figure 15, answering these questions:
“Who are the people, or users, who have a problem and would use our solution?<”/li>
“What problems do they have?”
“What is a proposed solution that would address their problem?”
Figure 15—Product snapshot
We again paired up with a neighbor to discuss our product snapshot, then participated in a broader discussion—a pattern that persisted throughout the day for most exercises. In the next 5-minute exercise, we answered the question “How does your business make money?” by listing the ways our company makes money in a Business Model column, then listing the kinds of people who pay for our product.
Know Your Customers
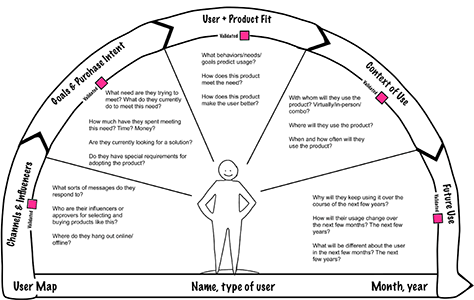
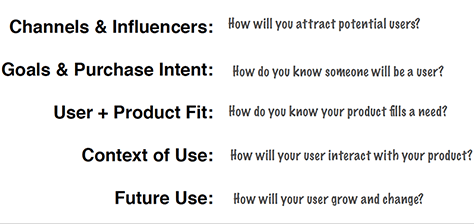
“Users are the thing we should all understand,” Laura stated. Then, she introduced the user map shown in Figure 16. A user map should be highly specific to a particular type of user. Capture facts about these users and their problems, behaviors, needs, and goals. Look at the past and future. When filling in the user map, answer the questions shown in Figure 17.
Figure 16—User map Figure 17—Questions to ask when filling in the user map
In subsequent, 2-minute exercises, when considering different parts of the user map, we asked the following questions:
Channels & Influencers:
“Where does your user learn about products like this?”
“What sorts of messages do they respond to?”
“Who are their influencers or approvers for selecting and buying products like this?”
Goals & Purchase Intent:
“What need are they trying to meet?”
“What do they currently do to meet this need?”
“How much time do they spend meeting this need?”
“How much money have they spent meeting this need?”
“Are they currently looking for a solution to meet this need?”
“Do they have any special requirements or needs for adopting this product?”
User + Product Fit:
“What behaviors/needs/goals predict usage?”
“How does this product meet the need?”
“How does this product make the user better?”
Context of Use:
“With whom will they use the product? Virtually/in-person/combo?”
“Where will they use the product?”
“When and how often will they use the product?”
Future Use:
“Why will they keep using it over the course of the next few years?”
“How will their usage change over the next few months? The next few years?”
“What will be different about the user in the next few months? The next few years?”
“Understanding the decision-making [and] buying process can help with messaging, positioning, and even user research!” said Laura. “Understanding user intent can help you know how much convincing and onboarding will be required in early user interactions. Understanding needs will help you predict which features are most important for specific users. Understanding how people use your product helps you determine the platform and design requirements. It can also help you protect your [users] by keeping their information safe. Understanding future usage helps you improve user retention by giving users an incentive to continue using your product after the first few weeks.
“Needs finding is the thing most neglected by product teams,” observed Laura.
After a listening activity, in which we split into pairs and each interviewed the other for five minutes about the process of buying furnishings for the home, Laura shared some guidelines for interviewing users:
“Ask open-ended questions.” Kate added, “If you’re asking open-ended questions, you’re talking maybe ten percent of the time. Try to talk less. Ask more questions. Ask follow-up questions.”
“Let the participant lead.”
“Give the participant something to reach to.”
“Recruit and screen participants to make sure you’re talking to people who will be helpful with the type of research you’re doing.”
“Understand why your participant does what she does or feels the way she does.”
“Shut up.”
Then, we tried interviewing one another again—this time about the online job-search process.
Measure Success
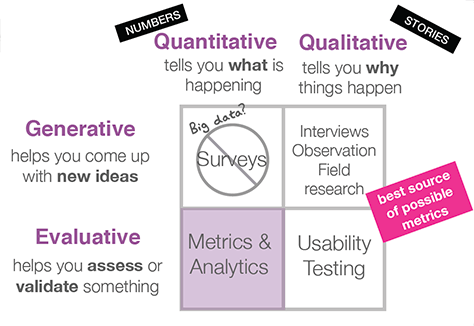
“Metrics are just user behavior described with numbers,” Kate told us. She discussed various user-research approaches that “help us know our product is working for our users,” as shown in Figure 18. “Qualitative research is the best source of metrics.”
Figure 18—User-research approaches
Metrics and analytics approaches include the following:
“click tracking
“analytics packages
“A/B testing
“KPIs / OKRs
“usage statistics
“conversions”
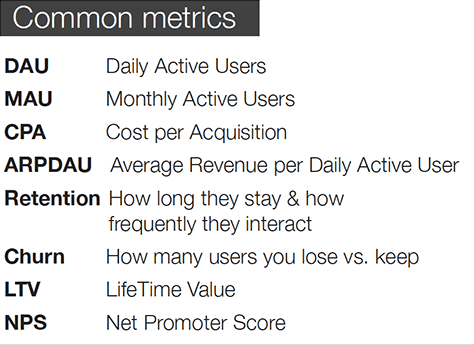
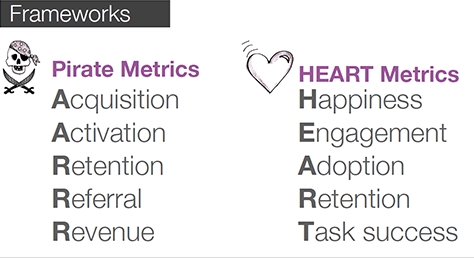
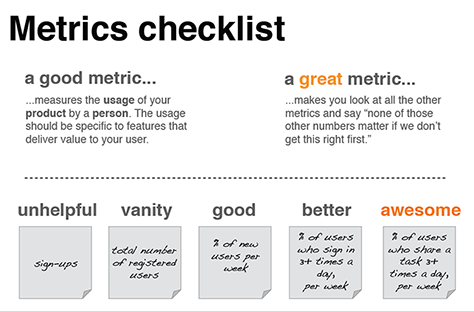
Figure 19 shows some common metrics; Figure 20, some metrics frameworks—Pirate metrics and Google’s HEART metrics.
“A good metric measures the usage of your product by a person,” and it is
clear and specific:
“Know what interactions represent the desired user behaviors.”
“Identify the specific interactions that support the action or behavior.”
“Find the numbers to track these interactions.
normalized—rate or ratio:
“Percentages are inherently comparative.”
“They balance out big changes in total quantities.”
comparable—time stamped:
“Captured at regular intervals.”
“Directly comparable over a span of time.”
actionable—not vanity:
“total number of users
“downloads
“page views
“likes
“funding press releases
“articles in media”
changes your behavior:
“Don’t just ask questions. Know how the answers to the questions will change your behavior.”—Alistair Croll, from Lean Analytics
“Lean analytics are the best metrics around products,” said Kate. “Numbers for vanity metrics only ever go up. They won’t change your behavior.” Laura advised, “Metrics should be about things users want to do. Metrics reflect user behavior,” as demonstrated in Figure 21. “They are predictive of better behavior,” remarked Kate. Laura explained that “leading metrics indicate future use. All metrics are inherently gameable.”
Figure 21—Metrics checklist
Our next exercise involved brainstorming ideas for metrics for three minutes, then focusing on one metric for five minutes to make it awesome—ensuring that the metric begins with a number and has a time basis and an object basis. “What could you count to make sure your feature
is working for your customers?”
Find Features
“Getting the right features and the features right.” Laura led a discussion about how we currently choose features. She said, “The feature isn’t the goal. The goal is the change in metrics that will come from a change in user behavior. The feature is merely the trigger for the behavior change. When you know the goal, you can think up a lot of possibly better featuers that could work.” In a ten-minute exercise, we assessed the last feature our team built—why we built it, what metrics we were hoping to move, and how we measured them.
In the final, ten-minute exercise, we chose a fairly big feature and considered its complexity. “How long will the feature take? What else do we have to build for this feature to work? Where is the complexity hidden? What does every piece of it imply?”
“When we understand the complexity of what we’re building, we make better decisions,” acknowledged Laura. “Good product managers say no all the time.”
Wrapping Up
“Users are metrics,” concluded Laura. This workshop covered a lot of ground in a fair amount of depth. I found the segment on metrics most edifying.
Strategy for Design Leadership: Climbing Strategy Mountain
Reviewer: Jim Nieters
Presenter: Dave Malouf
For his workshop, Dave used the metaphor of climbing strategy mountain, characterizing the following agenda as “The Plan for the Climb”:
Preparing for the Climb
Surveying the Mountain
Visualizing the Peak—depicted in the hero image at the beginning of this review
Determining the Best Path
Points: Observe, Measure, Learn, Adjust
As a metaphor, the concept of climbing strategy mountain worked as well as any other, in the sense that it helped participants visualize his core lessons. For example, to achieve any objective, you must know where you are and know where you are going—part of “Preparing for the Climb.” If someone chooses to follow Dave’s model, they can envision the purpose, value, and high-level process for each of these stages.
My overall impression of the workshop was that Dave has clearly internalizing how the corporate world operates. He has a firm grasp of how to stand back and decide how to best make an impact in his organization.
Preparing for the Climb
In the section “Preparing for the Climb,” Dave asked the core question: “What is Strategy?” He presented some examples of tactical versus strategic goals to highlight the differences. A tactical goal might be: “I will complete X by Y date.” The strategic corollary might be: “By completing X, Y, and Z, we will see a change in these key results that will tell us we are trending toward A, B, C.” While I agree with his point that, if we want to influence executives, we need to understand how to navigate the terrain of strategy, Dave’s examples of strategic goals could have been a bit more tangible and more relevant to UX design strategists.
Dave quite accurately pointed out that getting to strategy is not easy. Getting there takes an understanding of the following elements:
current state—knowing where you are
desired state—knowing where you are going
purpose and values—having a reason to make the climb
the plan—a map from where you are to where you’re going
measures of progress—landmarks to look for
Surveying the Mountain
In this section, Dave asked the question “What does your mountain look like?” He suggested that it’s all about perspective. Where are you in relation to the target? Are you far away? Are you near the goal? When you look at a mountain such as Mount Rainier from a long view, the mountain towers over everything, but from far away, close to your context—for example, downtown Seattle—Mount Rainier looks relatively smaller. But when you’re on the mountain and in the moment, you can lose track of the peak itself for whatever is in immediate proximity—the tasks you’re completing. So, when considering strategic objectives for a UX team, you need to realize that it’s all about perspective. The objective can seem so daunting as it appears today. But, if you can stand back and look at it in context, it can appear to be an attainable goal.
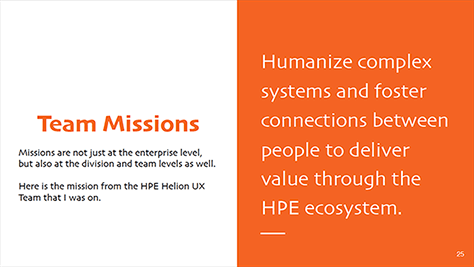
Dave then talked about the concept of creating clear team mission and vision statements to help align teams around what they need to do—and what the experience will be once they’ve achieved their goals. Figure 22 shows an example of a team mission for a team Dave worked with at HPE
Figure 22—Example team mission from HPE
Dave pointed out that a mission statement says what a team is going to do, while a vision statement describes what it will be like when the team arrives. Together, these statements provide teams with a sense of purpose.
At this point, Dave had tables break into groups to discuss our missions for ourselves and our teams in our current roles. He asked us to consider several questions, including the following:
What is our motivation?
What value will we create?
Who benefits from this value?
Why will they care?
We then shared stories—experiencing mutual empathy—learned from one another, and created a sense of aligned meaning within our groups. Dave provided some great examples of why an aligned vision matters. For example, Dave and his wife might agree to go on vacation. However, would he and his wife’s perspective of a great vacation be aligned? Without a shared vision, different members of a team might be running hard toward very different objectives.
At this point, Dave had us break into groups again, focusing on what it is like for each of us to communicate with our team. In Part 1 of this breakout, we shared stories; in Part 2, we created affinity diagrams of our stories. We found commonalities and worked to align our perspectives.
Visualizing the Peak
In visualizing the peak, the objective supports the purpose the team has defined for itself by first answering these questions:
What was the pain before?
What is the solution?
What is the value to the people you’re creating something for?
What data supports the solution?
How will we know when we’re successful?
Dave suggested that, when we’re identifying painpoints, solutions, and value, we tell emotional stories that engage executives. Sales teams present emotional arguments. Similarly, we should highlight the actual pain customers feel. Paint a clear picture of the experience customers will have when they experience the new solution.
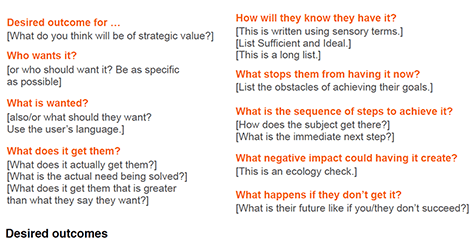
In lieu of telling a story, Dave recommended that we describe the desired end state as both sufficient and ideal, as shown in Figure 23.
Figure 23—Desired outcomes
Dave then walked us through a desired outcome exercise. For a specific product, we identified the following:
What is wanted?
What does it get them?
How will they know they have what they want?
When talking about how customers will know when they have their desired outcome, we need to use sensory terms. That is, we need to talk about what they see, hear, and feel. We also need to talk about what would be sufficient, or barely acceptable, versus what would be hopelessly idealistic, then identify what lies in between these extremes. The truth is that business factors such as market conditions, competitive pressures, financial viability, and resource availability determine that line between sufficiency and the hopelessly idealistic.
Next, we broke out into groups for another exercise, in which we worked through the entire canvas of a desired outcomes template. Referring to affinity work we did first as a group, we built out the canvas progressively, using Post-it notes. We added sensory and sequence input on different Post-it notes.
Determining the Best Path
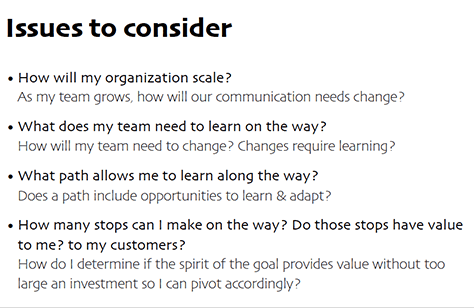
After a lunch break, we started discussing how to determine the best path to achieve the goal that the team aligned around earlier. To determine the best path to any goal, a team must decide how much detail it needs about the terrain it will be crossing. This will help them decide how much fidelity their final vision must have before they embark on their journey. When choosing the path, Dave recommended determining what issues the team must address by asking the questions shown in Figure 24.
Figure 24—Issues to address
The challenge I faced at this point in the workshop was attempting to tie the general issues Dave had presented—such as “deciding the best path” by asking questions like “how my organization will scale?” Because we were running out of time, Dave threw in some tangible data points and organizational issues for us to consider. I actually valued all of the points Dave made and the questions he asked— he was right on with them. Still, the challenge I had was understanding where I was—that is, understanding my context.
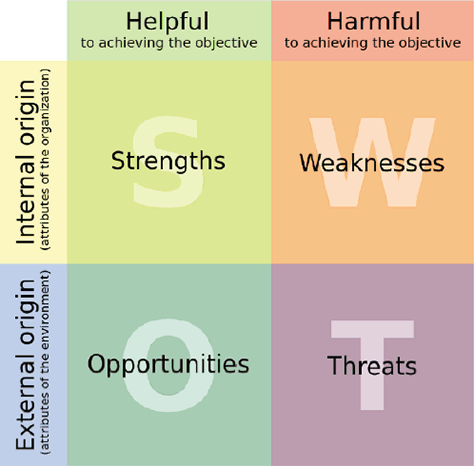
At this point, Dave walked through the process of conducting a SWOT analysis, which, as Figure 25 shows, is an analysis of
Strengths
Weaknesses
Opportunities
Threats
Figure 25—SWOT analysis
The purpose of a SWOT analysis is to evaluate each of these factors, enabling you to assess your ability to achieve your goal. While I agree that a SWOT analysis is a valuable tool in a strategist’s arsenal, I wasn’t sure why we were talking about it in this context, except that it’s a useful tool for strategists.
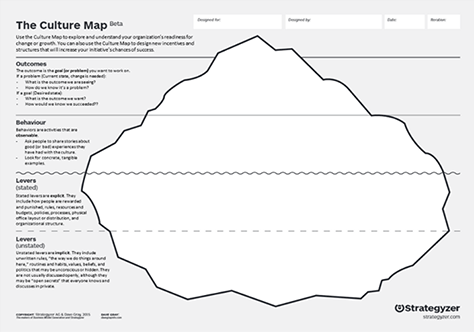
Finally, we learned about culture maps, which help teams understand their organization’s readiness for change or growth. (Figure 26 shows an example.) They also help teams to design new incentives and structures to increase their initiative’s chance of success. Using this tool can help teams identify possible outcomes and behaviors that would support or hamper their ability to achieve their goal. It also helps them identify explicit levers—for example, how people are rewarded and punished, rules, budgets, policies, processes, and organizational structure, so teams can drive change. It also helps them identify unstated or implicit levers or unwritten rules, routines, habits, values, beliefs, and politics that might be unconscious or hidden. This tool helps teams to understand the obstacles they might run up against and form strategies for circumventing these obstacles.
Figure 26—Culture map
Points: Observe, Measure, Learn, Adjust
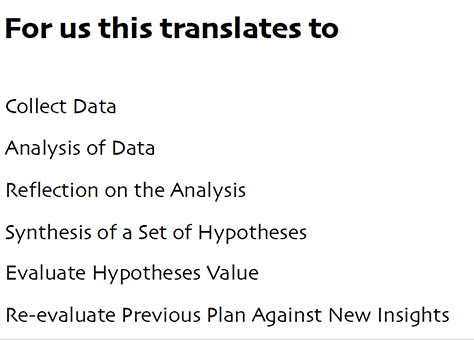
Next, Dave talked about what he called points—that is, the points at which teams should can collect data so they can learn and pivot, if necessary. If something is not working, teams should find new tools or ways of driving change. In this context, it is critical to gather data—both qualitative and quantitative data, as outlined in Figure 27. The data that teams choose to gather and present should:
Demonstrate value for the user.
Present enough data to be worth measuring.
Not be too far out.
Be well enough defined.
Figure 27—The process of data gathering and analysis
Dave introduced the acronym OODA, which stands for Observe, Orient, Decide, and Act. He suggested that all teams should have the instrumentation at their disposal to help them understand how the team is doing against their goal—the peak.
Nearing the end of the workshop, teams had the opportunity to build a path to their peak. Along that path, they reviewed the sequence of desired outcomes against the strategic issues Dave had described earlier. He suggested we ping-pong our plan against questions that set the path, but to be honest, I could not follow what this meant. Dave did point out that in our plans, we should be sure to add answers to the questions “What are we going to learn?” and “How are we going to measure it?”
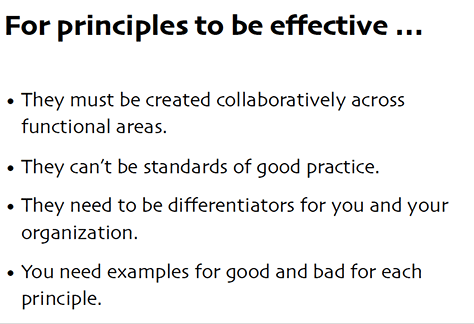
Dave shared some guiding principles that could provide focus, showing this example of the principles the Rackspace Experience Design team created:
Meet me where I am, as I am.
Speak in a humble and friendly tone.
Anticipate my needs.
Have my back.
Create clarity that allows me to focus.
Respect my time and my attention.
Recommend, but let me choose.
Amaze me with every detail.
These principles provided some criteria by which a cross-functional team could evaluate all feature and design decisions. Figure 28 points out what it takes for these principles to be effective.
Figure 28—Criteria for effective principles
In Summary
In wrapping up, the teams broke up and we discussed what would prevent us from using the knowledge we had gained from this workshop, what each participant would do to get past those obstacles, who each person could partner with to remove the obstacles, and what we would do first when we got back to work.
While I found Dave’s workshop valuable, it was quite challenging to understand where we were at any given point in the presentation. For example, by the time we got to “Surveying the Mountain,” I had a hard time remembering what came first and what was next. I felt a lack of orientation. In addition, I found it difficult to understand why he had included certain topics within a given segment of the workshop.
To clarify, the topics Dave shared were all valuable, and he included a great deal of information. Let’s take “Surveying the Mountain” as an example again. In this section, Dave talked about Mission, Vision, Purpose, and People—keeping things focused on human beings. We engaged in a break-out session during which we created stories about how our design teams communicate—the good and the bad. We then created an affinity diagram, found commonalities, and worked to align our perspectives. My group and I very much enjoyed the exercise. However, it was difficult to understand how it fit into the concept of surveying the mountain within the context of the course.
Perhaps the challenge I encountered arose because Dave presented so much material and had to move so fast. My recommendation to Dave would be to cover less detail and, instead, keep students focused on remembering his high-level message. I walked away with so many details Dave had presented in such rapid-fire succession that it was difficult for me to remember the most important points just a month later.
Let me say again that Dave’s points were all valuable and deeply insightful. The challenge was that in spite of his creating the great metaphor of climbing strategy mountain, I had a hard time building a clear conceptual model of his message. All in all, I would recommend this workshop, but I also recommend that Dave provide less detail and more context on where he is at any point in his climb up the mountain.
Conclusion
I’m really glad I was able to attend EUX 2017. This is an excellent conference on an important topic for today’s UX professionals and the business community in general. I’m looking forward to attending EUX 2018, which will again take place in San Francisco, on June 13–15—kicking off with a full day of workshops, then the two days of the main conference, which promise to be packed with valuable content.
Discount for UXmatters Readers—If you want to attend EUX 2018, register using the discount code UXMATTERS and you’ll get 15% off the price of your conference ticket.
Founder, Publisher, and Editor in Chief of UXmatters
Silicon Valley, California, USA
With more than 20 years working in User Experience at companies such as Google, Cisco, WebEx, Apple, and many startups, Pabini now provides UX strategy and design consulting services through her Silicon Valley company, Strategic UX. Her past UX leadership roles include Head of UX for Sales & Marketing IT at Intel, Senior Director of UX and Design at Apttus, Principal UX Architect at BMC Software, VP of User Experience at scanR, and Manager of User Experience at WebEx. Pabini has led UX strategy, design, and user research for Web, mobile, and desktop applications for consumers, small businesses, and enterprises, in diverse product domains. Working collaboratively with business executives, multidisciplinary product teams, and UX teams, she has envisioned and realized holistic UX design solutions for innovative, award-winning products that delighted users, achieved success in the marketplace, and delivered business value. As a UX leader, she has facilitated conceptual modeling and ideation sessions; written user stories; prioritized product and usability requirements; established corporate design frameworks, standards, and guidelines; and integrated lean UX activities into agile development processes. Pabini is a strategic thinker, and the diversity of her experience enables her to synthesize innovative solutions for challenging strategy and design problems. She is passionate about creating great user experiences that meet users’ needs and get business results. A thought leader in the UX community, Pabini was a Founding Director of the Interaction Design Association (IxDA). Read More


