Enterprise software faces a number of UX challenges, including the following:
Enterprise solutions often depend on integrations between multiple applications.
Few of these applications were built with the intent of integrating them into a system that supports a cohesive user experience.
There is a profound lack of information on UX-research approaches that are suitable for exploring integration issues for enterprise software.
This article is Part 1 of a series in which I’ll examine several critical software-integration considerations from a UX perspective. In Part 1, I’ll focus on how to characterize users’ mental models of the data that underlie enterprise systems. In cases where an enterprise is integrating two or more applications that have disparate, back-end data sources, UX research should guide efforts to align those data sources to achieve a seamless user experience. This article outlines specific approaches for characterizing both the current and ideal workflows for viewing, adding, or modifying data across multiple applications. It also identifies success criteria for use when evaluating integrated user experiences.
Champion Advertisement
Continue Reading…
The User Experience of Disparate Back-end Systems
A lack of integration can contribute to a number of undesirable UX outcomes. For example, think about the painpoints that emerge when the user must enter, update, and view customer information across several applications. When integrated software does not leverage common data from a single back-end system—that is, the applications do not share data—the user must add or modify information multiple times. The need for redundant data entry
increases the potential for introducing inconsistent or inaccurate data
increases the time necessary to complete tasks
relies on compensatory strategies such as data-verification checks to ensure data integrity
To understand how users might expect to interact with data across multiple applications, you must first know about the different types of data models that describe the relationships between the information that resides in the different applications.
Data Models and Their Impact on the User Experience
Understanding whether and how users expect disparate applications to share data is a critical component of any integration effort—whether the goal of that integration is to:
Maintain separate applications that interact with one another.
Meaningfully combine applications into a single platform over time.
Figures 1–4 depict four primary ways in which the applications within a user’s ecosystem can share data. In these figures, all of the applications are necessary components of a user’s workflow. Therefore, the user must use these applications in conjunction with each other to accomplish a series of steps in a larger overall task—for example, updating a customer’s address across multiple applications after the customer has moved.
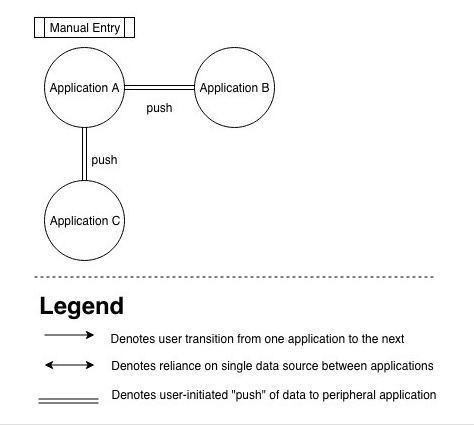
The Push Model
In the push model, which is depicted in Figure 1, the user manually enters data in one application—the originating application—then must remember to push, or propagate, the data to one or more peripheral applications manually. Only then can the user view the data in the peripheral applications. Similarly, if the user changes data in a peripheral application, the originating application won’t reflect those changes unless the user explicitly pushes the data back to that application. Thus, the data are not truly shared; they’re actually two different instances of the data from two distinct, underlying databases. To maintain the data’s consistency, the user must continually update, then manually propagate the revised data to all connected applications. Therefore, the data’s consistency depends on user-initiated behaviors such as sending or pushing rather than on automatic updates.
Figure 1—The push model
The Manual Model
In the manual model, shown in Figure 2, no integration exists between applications. In such cases, the user cannot take even such rudimentary actions as pushing or sending data to connected applications; instead, the user must manually enter the data in each application within the workflow. The user is fully responsible for ensuring that the data are accurate and consistent across all applications. This results in additional work for the user and increases the likelihood that he may introduce errors or inconsistencies into the data. To compensate for this problem, users often bookmark each application and use multiple tabs or monitors to ease the copying and pasting of data from one application to another.
Figure 2—The manual model
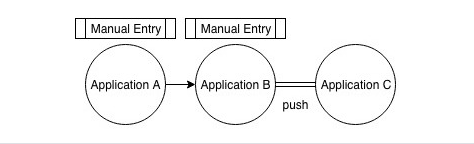
The Hybrid Model
The hybrid model, shown in Figure 3, combines features of the manual and push models into a single workflow. Some applications in the workflow may require manual data entry, while other applications may be able to push data to peripheral applications in the ecosystem. Thus, the user must manually enter data into one or more applications, only some of which permit the user to push data to some other peripheral applications.
Figure 3—The hybrid model
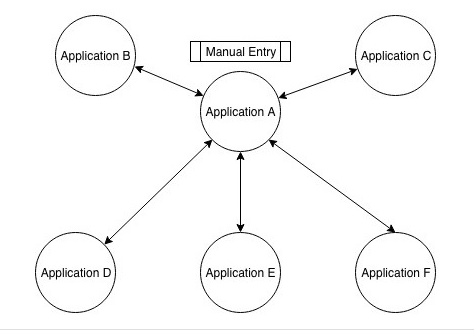
The Shared Model
Finally, in the shared model, shown in Figure 4, a single database on the back end contains shared data. Sharing data does not require the user to push or send data from one application to another; nor does it depend on user-initiated, manual data entry across multiple, disparate applications. Once the user enters data manually into a single application, the data automatically propagate across all integrated applications. Adding or modifying data in any integrated application causes that data to update automatically in all of the integrated applications throughout the user’s entire ecosystem.
Figure 4—The shared model
Note—While Figure 4 depicts the data as originating in Application A, the user could actually enter data in any of the applications and that data would automatically appear in all of the applications.
While the shared model eliminates the need for redundant data entry by the user and ensures the consistency of shared data across all integrated applications, users have raised a concern about sharing data across applications: if the data are wrong in one place, they’re wrong everywhere. Therefore, it’s critical to ensure the accuracy of data entry—both where the user initially introduces the data and wherever editing occurs. In a shared-data model, adding and modifying data can influence data quality because the system shares the data across all integrated applications.
Summary of the Data Models
Table 1 provides a summary of the characteristics of each of these data models, as well as their expected impacts on user behavior.
Table 1—Comparison of manual, push, hybrid, and shared data models
Characteristics
Manual Model
Push Model
Hybrid Model
Shared Model
How do users make additions, modifications, and deletions?
Users must enter data manually in each separate application.
Users enter data manually in one application, but must explicitly push or send that data for it to populate integrated applications.
Combines the manual and push models, so some applications require manual data entry, while others let users push updates to peripheral applications.
Users can enter data manually in a single application and changes update automatically in all integrated applications, with no additional effort by the user.
Are updates automatic?
No
No
No
Yes
What back-end databases are necessary?
Each application has its own separate database, which cannot accept data from other applications.
Each application has its own separate database that can accept pushed data from other applications.
Each application has its own separate database, but only some of the applications can accept pushed data from other applications.
There is a single database for all applications in the users’ ecosystem.
What is the likelihood that the data in a record’s fields are consistent across applications?
There is a lower likelihood of consistency.
There is a lower likelihood of consistency.
There is a lower likelihood of consistency.
There is a higher likelihood of consistency.
What factors affect data accuracy?
The risk of human error is highest when there is redundant data entry.
Factors include human error, inappropriate mapping of fields on the back end, and the need for users to check the accuracy of pushed data.
Factors include human error, inappropriate mapping of fields on the back end, and the need for users to check the accuracy of pushed data.
The main factor is human error.
What is users’ perception of the effort that updating data requires?
Redundant, manual, data entry requires significant effort.
Pushing data to integrated applications requires less effort than in the manual model.
Pushing data to integrated applications requires less effort than in the manual model, but some applications require manual data entry.
This model requires the least effort because users must enter or update data in only one application, and the data populates all integrated applications automatically.
What is users’ perception of the risk inherent in updating data?
Moderate risk because of increased opportunities for error during multiple rounds of redundant data entry.
Lower risk because of users’ entering data manually in one application, then explicitly pushing it to peripheral applications.
Moderate risk because of increased opportunities for error because some applications require redundant data entry.
High perceived risk results because, if the user enters data incorrectly in one place, the data are wrong everywhere.
In general, there appears to be an inverse relationship between perceived risk and perceived effort. Therefore, as users’ effort increases, they often perceive less risk and vice versa. This is especially true for the shared model: even though the user’s effort is extremely low, there is an increased perception of risk. David Ropeik and George Gray’s research indirectly supports this perceived relationship between user effort and risk. The research shows that users’ perceptions of risk tend to increase when they perceive a lack of control.
Assessing Users’ Mental Models of Shared Data
Users are not generally aware of their own mental representations of the way data propagate across the applications they use. Many are unaware of the rules that govern their own role in adding, updating, and distributing data across their applications. Getting users to articulate these beliefs explicitly can be challenging. To elicit users’ understanding of how data in one application relates to the same data in other applications, UX researchers must often use indirect ways of questioning them to surface their behaviors, attitudes, or motivations.
Contextual inquiry is a superior research method for investigating users’ mental models because it permits an open-ended, participant-led exploration and lets researchers ask follow-up questions and probe more deeply to understand the mechanisms behind users’ behaviors and attitudes.
Defining the Current Workflow
When evaluating integration opportunities across applications, it is critical that you first establish how your users are currently engaging with their applications to complete their work. In defining workflows, you should document answers to the following questions:
In what sequence do users engage in their tasks, including the order in which they transition from one application to another?
How do users transition from one application to another? Be sure to document whether users have bookmarked their applications or have applications open in different tabs, browsers, or windows or on different monitors. If possible, document the way users have arranged these applications on their screens.
If users routinely set up different applications on separate monitors, what purpose does this serve? Is there a difference in the types of information on one screen versus another? Do users group applications on different monitors because of the conceptual relationships between them? For example, are all communication tools on one monitor, while everything else is on another monitor?
Do users close an application after completing their work in it? If users keep an application open with the intent of returning to it later, what would be the purpose of returning to the application? Do users need to return to the application to double-check data at a later time?
Where do users enter information manually? Can they push data from one application to another? When users enter data manually, are they copying it from a physical document? Are users copying and pasting data from another application? Are the applications open side by side on a screen to facilitate duplicate data entry?
Do applications push data completely and accurately to other applications? If not, what does not transfer over properly?
Do users need to employ any sort of data-verification checks? Do users need to compare the same set of data across multiple applications for completeness and accuracy? If so, what has prompted them to incorporate this check into their process? How do users accomplish these checks?
Do multiple users share certain workflows? Do multiple users need to enter the same data into separate applications? How do users relay work to other users? How do users ensure the consistency of the data they have entered independently?
Do users sometimes enter data incorrectly or inconsistently? How do they identify their errors? What impacts do these errors have? How do users correct their errors?
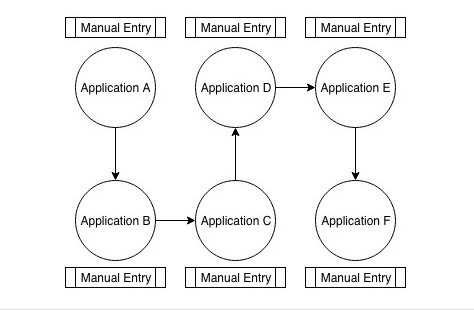
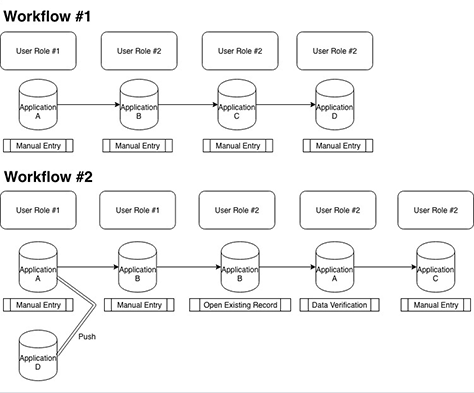
Gathering all of this information lets UX researchers construct detailed workflow diagrams that depict the sequence of events in a workflow, who was responsible for each part of the workflow, where users entered data manually, whether an application required users to return to it later, and whether users included data-verification checks as a component of their workflow.
Figure 5 shows two examples of such workflow diagrams. They show the sequence in which users must update information in applications, whether they update data manually or push it to peripheral applications, and which users are responsible for specific parts of each workflow. Workflow #1 depicts a manual model, while workflow #2 depicts a hybrid model.
Figure 5—Two example workflow diagrams
It is important to ask users why they do the things they do. This provides insights into the compensatory mechanisms users may have developed in attempting to deal with suboptimal workflows that fail to support their needs adequately. For example, asking a user why he keeps Application A open after entering customer information into it might reveal that the user needs to return to the application later to compare the information in Application A with that in Application C for accuracy. However, users rarely offer such details without some prompting because they don’t seem significant to them. So ask targeted follow-up questions to surface such details.
In addition to asking why, it is also crucial to ask users to describe any impacts of incorrect or inconsistent data across their applications. This provides insights into the downstream effects of incorrect and inconsistent data. When you state that users have problems with inconsistent data, you’re merely stating the primary issue. To gain a more comprehensive perspective on the impacts of inconsistent data, you must dive deeper. How does the user discover data inconsistencies? What does the user have to do to correct them? Did the inconsistencies have any impact on the process the user was trying to complete? What happened next? And then what? And how did the user resolve the issues? Think about how the introduction of inconsistent data can cause a long sequence of consequences that you must unearth and document.
Characterizing the Ideal Workflow
Once you have defined the users’ current workflow, it is important to spend time characterizing how users might prefer to accomplish their work differently. However, it is not fruitful to ask users, “How would you prefer to do this work?” Don’t ask users to design a solution during an interview. Instead, consider exploring the following questions:
Do users believe they could accomplish their work in fewer steps? Which steps do they think could be eliminated? Why? What would be the value of being able to accomplish their work in fewer steps?
Should users enter data from just one place, or should they be able to enter data into the system from multiple places? Why? What is the primary place in which users would want to do this work? Do they conceive of adding new records as a task they should accomplish in a different application from editing existing records? Are there applications in which users should be able to view certain data, but not modify it?
Do users ever open an application in another tab solely for the purpose of adding, editing, or verifying data across applications? If duplicative data entry were no longer necessary—for example, when using a shared model—what impacts would this have on the workflow?
When users update data in one application, do they value that data automatically populating other applications? If so, what is the timeframe in which users expect the data to appear in integrated applications that share a common back end?
If, after adding or editing data, users expect the data to be available immediately in integrated applications, but the data are not available immediately, what messaging should appear to inform users of this?
Do users have the expectation that they’ll be able to view changes they’ve made to shared data? Do users ever want to revert data back to a previous state? What is the value of this capability?
Are there specific cases in which users would prefer making manual updates to the data rather than the data updating automatically?
Gathering this information from users gives UX, product, and technical teams a good idea of how best to support users’ needs as an organization pursues an integrated platform. Everything you have discovered by asking these questions provides the basis of your change-management strategy for UX integration.
Putting It All Together
Once you’ve documented the users’ current and ideal workflows, you’ll have a solid understanding of what issues you need to address to best support users’ needs. You might be wondering why you should bother to define the current workflow rather then just skipping ahead and documenting only the preferred workflow. One important reason for defining the current workflow is to identify a pre-integration baseline. If you haven’t documented the user experience before an integration, it won’t be possible to measure UX improvements that are attributable to that integration.
This baseline also clearly illustrates to your entire organization the problems that you need to address. Based on the results of your discussions with users, you can construct a measurement plan that articulates the relationships between user problems, product goals, and the KPIs that you’ll use to measure the success of your integration efforts. Having such a measurement plan is critical for integration efforts. Table 2 provides an example of such a measurement plan.
Table 2—Example plan for measuring the UX impact of shared data
Pre-integration User Problems
Goals and Expected Outcomes for Integration
How to Measure Outcomes
Redundant data entry across applications
Reducing duplicate data entry
Using Google Analytics, count the number of users entering the same data across multiple applications, before and after integration.
Multiple data-verification processes
Decreasing the need for multiple data-verification processes
Determine whether users need to verify data multiple times during a task, before and after integration.
Fragmentation of data across applications, potentially resulting in inconsistent data
Eliminating the need to modify data in individual applications
Assess users’ perception of data quality and their need to correct data, before and after integration.
Lengthy task-completion times
Reducing task-completion times
Assess users’ perception of the time it takes to complete tasks, before and after integration.
Documenting the current workflow, the ideal workflow, and well-defined success metrics ensures that product teams collectively consider business goals, user needs, and technical constraints when making decisions. Best of all, you’ll have a story to tell that shows where the users started, where they ended up, and how well-defined success criteria enabled clear measurement of the users’ integration journey.
References
Ropeik, David, and George Gray. Risk: A Practical Guide for Deciding What’s Really Safe and What’s Dangerous in the World Around You. Boston: Houghton Mifflin Company, 2002.
Fantastic article! Thank you so much for sharing these insights. I especially liked the connection you drew between the concepts of effort and perceived risk correlating similarly to how effort and perceived control correlate. It made me want to include assessment questions in your “How to Measure Outcomes” column about perceived control along with the question about perceived risk/confidence and time/effort.
That’s a great point, Henry! Perceived control would certainly be an interesting dimension to track, in addition to the ones outlined. Thanks for reading and commenting!
This is a much deeper analysis here than most UX explorations I have seen in the past that assume a greenfield design challenge, which is not the case for many organizations now.
FYI this related piece on a UX/integration challenge we faced and how we dealt with it in healthcare, has links to some of the concepts here, so openly sharing here:
Amy has over 20 years’ experience as a professional researcher, both in the field of neuroscience and, more recently, in the UX space. She earned her PhD in Psychological & Brain Science from Dartmouth College. Amy’s training has informed her approach to understanding users. Her primary professional interests align with platform UX, a term she has coined to describe her approach to understanding the user experience from the perspective of platform-level concerns. These concerns include data sharing, data availability, permissions, and information architecture. Amy has dedicated herself to promoting the value of UX research among stakeholders and pioneering collaborative-research approaches for UX professionals, technical teams, and product managers. Read More