The ultimate goal of any product manager is to create a better product or service. But with this role comes great responsibility because every mistake product managers make can cost their company lost revenues. That’s why great product managers reject a reliance on people’s gut instincts and subjective views and instead rely on data in making as many product decisions as possible. Thankfully, we today live in a data-driven world, which makes the product manager’s job a lot easier.
In this article, I’ll discuss a number of data-driven methods of understanding the performance of Web sites—especially their conversion rates—and how to use this data to improve their results through iterative design. Thus, these methods are equally useful to UX professionals.
Champion Advertisement
Continue Reading…
How Does Using Data Result in More Conversions?
Generally, the main task of any product manager is making product decisions that would positively affect the business and ultimately lead to higher conversion rates—and consequently, their companies’ earning greater revenues.
Such decisions could be large or small, but all of them must be measurable and, therefore, data driven to avoid a negative impacts on the business. Product managers apply data to decision making in the following key areas of their work:
making product hypotheses
devising creative solutions
identifying what needs improvement
analyzing feedback from users
doing A/B testing to validate any design changes
examining users’ behavioral data
tracking the results of any product decisions
The work of the product manager looks like this:
Looking at a lot of data to identify problems or areas to improve
Analyzing more data to try to identify the causes of these problems
Collaborating with their product team on solutions to these problems
Gathering even more data to validate that the proposed solutions would fix the problems
Tracking analytics data to validate that the implemented changes have helped solve the problems
Everything depends on obtaining the data you need.
Gain Foresight by Analyzing Company Trends
You probably have an ocean of data coming out of Google Analytics and other data-analytics tools, so the best approach is to start looking for problems or gaps in performance. One great way of making data actionable is checking annual, quarterly, or monthly trends. What is happening with company revenues and costs over time?
Try different breakdowns of the data to identify problem areas—for example, you could analyze your data by
product categories
customer segments
best-selling products
customers’ geographic regions
If you see any irregularities in the data, try to identify potential problems. For example, if some specific product category has decreasing revenues while the others are growing, you need to look at its category page, as well as product pages in that category, to identify potential trouble.
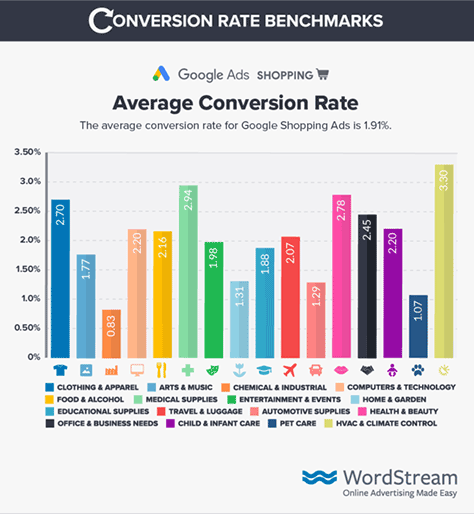
Of course, the main success metric for any company is revenue. For your online presence, track such parameters as conversion rates—that is, how many users of your site have completed a target action such as buying products, placing orders, signing up, or sending requests. The appropriate levels of conversion rates differ from niche to niche—from 0.83% in chemical and industrial areas to 3.30% in climate control, as Figure 1 shows. As a rule, 2.35% is considered an average conversion rate. If you notice a drop in a conversion rate, you must identify and remedy the cause. In actuality, much of the work a product manager does involves looking for ways of increasing conversions.
There are several potential problem areas for conversion rates, as follows:
calls to action, or CTAs
value propositions
copywriting
visual cues
Calls to Actions
CTAs are at the core of conversion potential. The intent of all the copy on a landing page should be to engage users in fulfilling the CTA. Make sure that a CTA is
specific—CTAs such as Subscribe or Try Now are very generic. Try to be more specific with your CTAs. Instead of Try Now, choose something like Free 7-day trial, no credit card required.
visible—A CTA should be visible, noticeable, and placed above the fold on a page—that is, it should be immediately visible without any scrolling.
easy to agree to—Try to avoid using words or phrases such as Buy or Sign Up, which immediately give the user the feeling that they’ll be parting with money or subscribing to a never-ending email newsletter. Instead, try words such as Get, Learn, or Download Our Guide.
Value Propositions
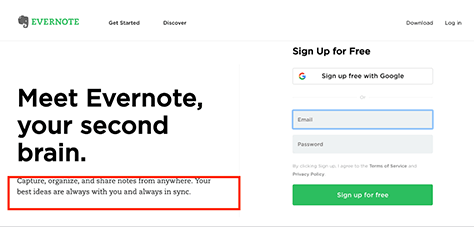
A value proposition should state how you’re going to solve potential customers’ problems, should preferably be unique, and speak about specific benefits you’re offering. Your unique value proposition (UVP) is not a slogan. It defines exactly how your business or products can help your customers. Usually, this value proposition appears on the home page of an organization’s Web site, as shown in Figure 2, or on a product page, often in the header.
The following are the characteristics of a good value proposition:
clarity—Your value proposition should be easy to understand.
specificity—It should describe some specific benefit that would accrue to your customers.
uniqueness—It should explain what makes your organization or product different from its competitors.
simplicity—Avoid using too much business jargon or an excess of hype.
brevity—Anyone should be able to read and understand a good value proposition in a few seconds.
Copywriting
Usually, a landing page contains more copy than just the value proposition and CTA. There might be descriptions of a product’s features and benefits, as well as other blocks of content such as testimonials, charts, or photos. To achieve a higher conversion rate, make sure the copy has the following attributes:
audience-related—Target the text for your intended audience and write it in language they’ll easily understand. Mention the problems your product solves and show the product in photos and videos.
storytelling—Try to invoke good storytelling wherever you can. For example, one opportunity for storytelling might be in a testimonial, in which a customer describes a huge problem that your product has solved.
Visual Cues
It becomes more challenging to keep the user’s attention on a page every year. You have around 8 seconds to catch the user’s interest. Design drives 94% of first impressions. So, to make a good impression on users in just a couple of seconds and make them want to stay or even make a purchase, your design should be understandable and engaging. When you’re designing your Web site, a deep understanding of design, usability, and the psychology of the user can significantly impact the conversions you get.
Designing visual cues—the visual elements on a page that lead users to calls to action or other important areas of the page and help users to interact with your platform effectively—is a design technique that you can easily implement and that can show great results. Here are some types of visual cues that can boost conversions:
explicit visual cues—These cues might be arrows that point to the target area, as shown in Figure 3.
suggestive visual cues—An example would be a photo of people looking at a product on your Web site.
surrounding whitespace—Whitespace around the target button or block makes it stand out.
color contrast—As a rule, the block to which you want to attract the user’s attention should be in a contrasting color to the rest of the page—often in darker colors.
encapsulation—Use framing elements to focus the user’s attention on a specific block of content on a page.
Figure 3—A strong explicit visual cue on Sage’s Web site
Understand User Intent by Analyzing Search-Results Pages
When optimizing conversions, it helps to start at the source of your traffic, which is often a search-engine results page (SERP).
Try entering your target keywords into a Web-search engine. You’ll see that even the general layout of search-results pages can differ from time to time. A search-results page might show a knowledge panel, news widget, or a shopping box, along with other possible keywords. Google analyzes not only the search query, but also the user intent behind it.
SEO (Search-Engine Optimization) specialists see customer intent as one of four types:
informational—The user is looking for information on a particular topic.
navigational—The user is trying to find a specific company or product.
commercial—The user is interested in certain products or services, but is not yet convinced and ready to make a purchase.
transactional—The user is ready to buy.
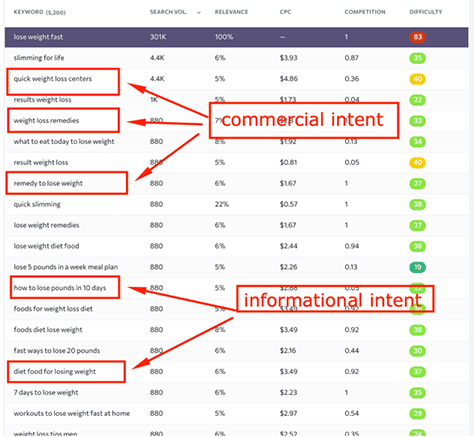
In Figure 4, you can see examples of two of these types of customer intent.
Figure 4—Keywords that show commercial and informational intent
The goal is to display relevant search results for each likely user intent. Of course, it would be tough to sell anything to somebody who isn’t convinced, and it is just plain ineffective to offer more general information to a customer who is screaming, “Take my money!” So your task here is to divine and understand user intent from the keywords users type and display search results that would be relevant to them.
There is no magical tool that can tell you what specific user intent is lurking behind each search query. But you can try using professional services such as SE Ranking, which lets you monitor live search results for each keyword without leaving the service and, thus, understand the user intent hiding behind each query. This service also has a powerful Keyword Rank Tracker tool that helps track keyword rankings from all search engines, for different locations, devices, and languages. With this tool, you can analyze data such as the following:
search volume
SERP features
keyword-effectiveness index
Web-site pages that rank for the keyword
difficulty
dynamics
Using their Related or Similar Keywords list, you can click each keyword and analyze the top 100 pages from the SERP that rank for those keywords.
Identify Product-Page Errors
Start by identifying technical problems or proving the absence thereof. Make sure your pages actually open, load reasonably quickly, don’t have any bugs or usability issues in the checkout process, and that the design looks good on smartphones.
You can do most of this through a Web-site audit, which you’ll typically carry out with the help of specialized software. Plus, the SE Ranking service that I mentioned earlier can be useful here. While performing a Web-site audit, look at the following metrics:
Domain authority
Security—for example, HTTPS and SSL certificates
Page indexing
On-page SEO issues such as problems with meta tags and links
Links—both internal and external
Then evaluate the content of your product pages. Look for any potential UX design problems. To improve conversions, the main questions that you need to ask yourself regarding usability are as follows:
Do photos and videos of the product look crisp, clear, and professional?
Is there a zoom feature to look at photos in more detail?
Is the main CTA button clearly visible and engaging?
Is the product description clear and does it answer most of the questions customers might potentially have?
Are customer reviews and trust badges visible?
Is the checkout or registration flow too complicated, and is there a guest-checkout capability?
Is there online support, and is it easy to find on the Web site?
Use Weighted Web-site Behavioral Data
When reading the previous section, were you asking yourself, How on Earth can I find data on all of this? Fret no more. Let’s look at the tools I mentioned earlier in greater detail. Here are some tips to help product managers better understand Web-site data and make data-driven decisions. Try using the following tools to understand users’ behaviors:
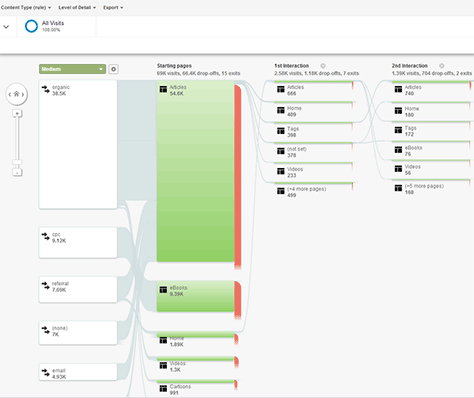
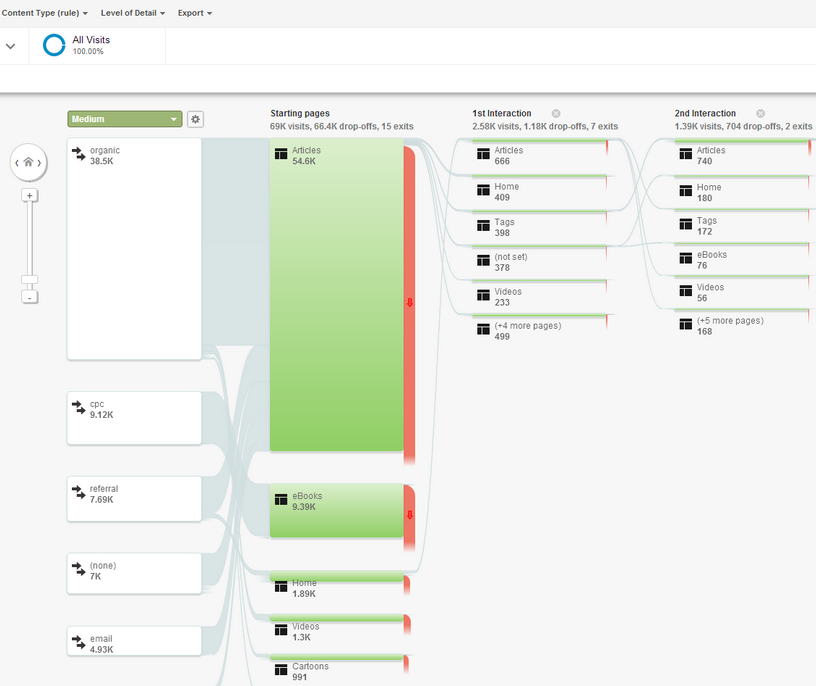
monitoring behavior flows—With the Google Analytics Behavior Flow report, shown in Figure 5, you can clearly see how users flow from one page to another. Based on this data, you can spot key trends such as half the users who visit page A also go to page B or almost nobody goes from page C to page D.
tracking users’ interactions—With Google’s Page Analytics Chrome Extension and Hotjar, you can see how users actually interact with your pages and where they click. In this way, you can understand which products are in greatest demand and which links and buttons on a page users click most, then improve these pages’ design to increase conversions.
comparing traffic on different channels—Go to Audience > Mobile > Overview in Google Analytics to learn a site’s share of desktop versus mobile traffic. Using this data, you could justify the need for responsive Web design or mobile usability testing.
checking pages’ traffic—Go to Behavior > Site Content > All Pages in Google Analytics to learn which pages are getting the most visits and spot some trends over time. Perhaps some of your pages are gaining in popularity, some have always been and remain popular, and some that were once popular are no longer.
identifying exit pages—Use Exit Reports to identify the pages from which users exit the site. If users leave in the middle of a process, you may have usability issues. If they leave from blog pages, their content might be too complex for users or, in contrast, lack sufficient expertise to answer their questions. Plus, you can simply ask your customers why they are leaving by offering them an exit-intent pop-up survey that you’ve created with Hotjar.
segmenting visitors—Don’t jump to conclusions based on site-average figures. For example, there would be an understandable difference in conversion rates between visitors who arrive by using hot, ready-to-buy keywords and visitors who submitted information-seeking queries and clicked a blog post on the SERP. Several basic segmentations to consider include the following:
new visitors versus repeat visitors
desktop versus mobile
customers who have already made purchases versus new customers
segmentation by traffic source or type
segmentation by geographic location
If you come to a point when you just don’t know which segmentation option would be better, unholster the favorite weapon of every product manager: A/B testing.
Conduct A/B Testing
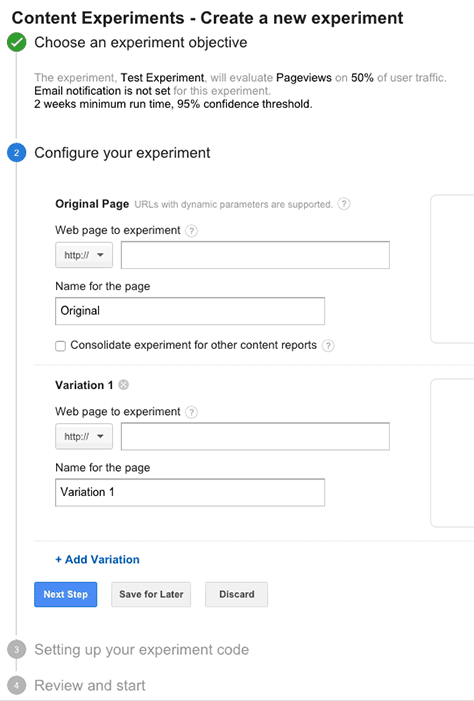
A/B or split testing or multivariate testing lets you assess which version of a landing page drives better conversions. Such testing splits your site visitors into two or more different groups and shows each group Version A and Version B of your landing page, for example, and measures their conversion rates. Numbers matter!Figure 6 shows the process of setting up a Google Analytics content experiment.
Figure 6—Setting up a Google Analytics content experiment
My main advice to product managers is to reject their biases—for example, their opinions about UX design decisions they do or don’t like.Start by creating a reasonable, logical hypothesis regarding why a new feature, page block, content, or anything else on a product page should work better than another—perhaps because it is more informative, more engaging, or more evident. You should ultimately do A/B testing on both versions, keep the best-performing page, then iteratively try to improve the landing page and test it again and again. Judging only by the data, you can improve your landing pages, which ultimately leads to better conversions, revenues, and profits.
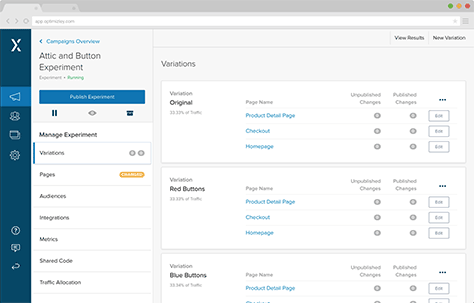
There are many tools to help you run A/B testing on your pages. Google developed Optimize, and there are many others such as Optimizely, which is shown in Figure 7. To the great relief of product managers, most of these tools allow you to run A/B tests with no or only minimal involvement of Web developers, reducing the time and costs of testing design changes.
The great benefit of A/B testing is that you can see exactly how much improvement in revenues a new version brings to the business, either in percentages or in dollars. Understanding the cost of making the design changes, then seeing the outcomes of those changes makes it very easy to calculate the return on investment (ROI) resulting from your conversion-optimization efforts.
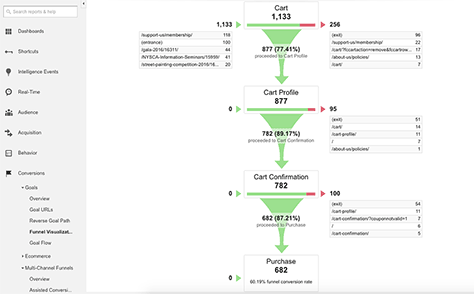
Funnel Analysis
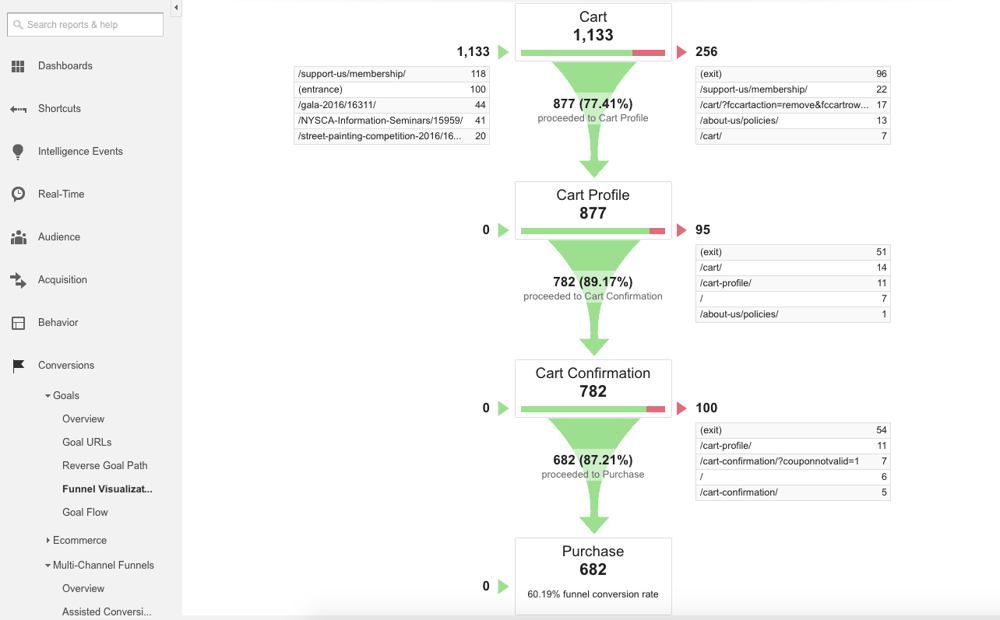
Google Analytics also provides funnel analysis, which lets you precisely track the impacts of design changes on revenues. Just go to the Conversions > Goals > Funnel Visualization page, shown in Figure 8.
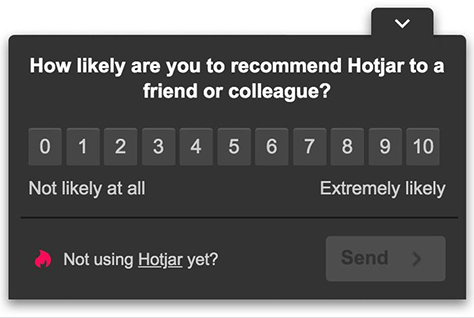
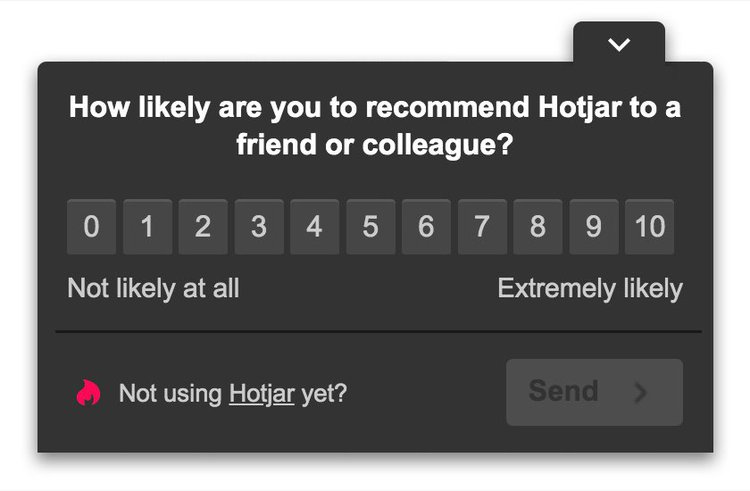
A Net Promoter Score (NPS) is a very useful customer-satisfaction metric. Conducting an NPS survey lets you measure a Web site’s Net Promoter Score. You can easily set up NPS surveys on your site using Hotjar, shown in Figure 9, or other similar tools. These surveys typically ask customers how likely they would be to recommend your product or service on a scale of from 0 to 10. The NPS is the percentage of people answering 9 or 10 minus the percentage of people answering 6 or lower.
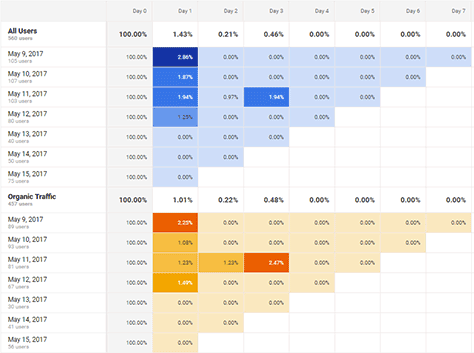
Another useful technique is cohort analysis. In Google Analytics, go to Audience > Cohort Analysis, which is shown in Figure 10, and create user cohorts based on the date of their first visit, then track how their behaviors change over time—for example, goal completions, page views, and revenue generation.
Product management is one of the most data-driven professions. The data you can gather through data analytics is very useful to UX professionals as well. Thankfully, there are many tools that supply the data you need to consider and give you the ability to test your design ideas. First, be sure to develop a logical hypothesis for making design changes—one that is based on existing data whenever possible—then test the results of your changes. For example, you could segment your data to provide more definitive conclusions. Through accurate measurement and rational thinking, you can apply analytics data to improving a Web site’s results.
Diana is a digital-marketing specialist and freelance business consultant who has eleven years of experience in her field. Diana loves blogging about digital trends, online marketing, search optimization, and business. Over the last six years, Diana has developed the practice of accumulating qualitative and quantitative data for her clients’ use in business-strategy development. As the popularity of data-driven approaches has grown over the years, Diana spent a lot of time creating beginner’s guides and developing expertise. This effort has resulted in her successfully implementing a data-driven approach for twelve of her clients and more than 1000 readers of dedicated data-driven blogs. Read More

