This final part of our UX STRAT 2014 series of reviews covers Day 2 of the main conference. Attendees of UX STRAT 2014 reconvened at the Boulder Theater, in Boulder, Colorado, for Day 2 of the conference on Tuesday, September 9. Paul Bryan kicked off Day 2 with his opening remarks.
Champion Advertisement
Continue Reading…
Here is the program for the last day of the conference:
Here are some highlights from Day 2 of UX STRAT 2014.
The Role of UX in Defining the Future of Products, Brands, and Business Strategy
Reviewer: Jim Nieters
Presenter: Theo Forbath
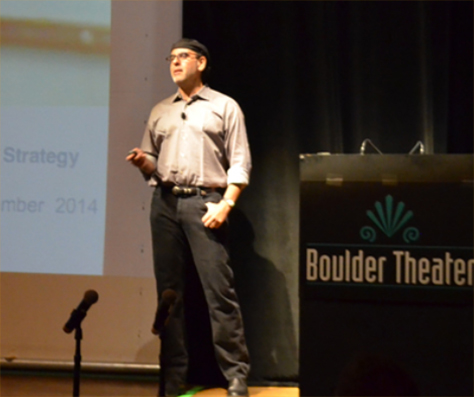
Theo Forbath, shown in Figure 1, who is Global VP, Digital Transformation, at Cognizant, opened Day 2 with his keynote address. He began by telling us that User Experience will be essential in defining products, brands, and business strategy for the companies of the future. As shown in Figure 2, Theo has focused his career on helping companies to innovate by leveraging technological disruptions.
Theo pointed out that we are experiencing a digital revolution because of the way
“businesses view the evolution of technology and its impact on products, brands, and personal data
“personal data and digital exhaust shapes brands, businesses, and experiences”
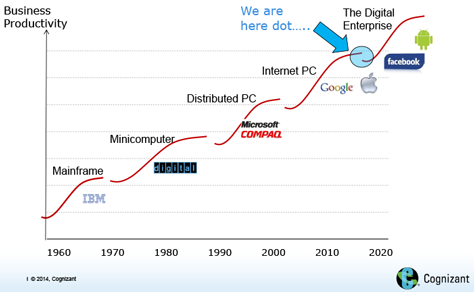
Theo observed that, because of this digital revolution, “the world of products, brands and personal data is going through a radical transformation.” And we’re moving “from a world of things to a world of smart, connected, programmable things.” If we look at the history of technological disruptions, we can identify several waves.
The first wave was about personal computing on a fixed desktop platform. In this environment, users valued their content and their access rights. The network knew their role and access rights, but that was all. During this wave, users linked with IT assets and corporate information.
In the second wave, things “got personal”—in a world where users are “mobile, always connected, and always on.” In this environment, users value a great deal more, including social graphs, photos, and apps. The network of the second wave knows a great deal more about us as well. It knows our location, personal information, behaviors, and overall digital footprint. During this second wave, users have linked with each other, and the system can take advantage of its personal knowledge about us through digital advertising.
The third wave, which is upon us now, will be deeply personal and contextually relevant. Theo said, “The third wave is about great UX design and the seamless, contextually relevant interactions of things and people.” It is also about “technology diffusion, democratization, and decapitalization.” As depicted in Figure 3, Theo gave an example of a parent of a child who did not have a functional hand. Rather than rely on the medical community to fabricate a hand at an exorbitant cost, this parent was able to fabricate a hand using a 3D printer, so his son could grasp and throw a ball with his friends. This truly represents the democratization and personalization of technology.
Figure 3—Democratization and personalization of technology
In this third wave, users offload decision making to networks of smart, connected, programmable things that know our interests, behaviors, locations, destinations, and emerging needs. Plus, advertising shifts to providing relevant content, and users are willing to give up what they would have considered private information in the past to receive new forms of value. And systems know virtually everything about us, including our likes, dislikes, and preferences; and our medical, financial, political, professional, and physical profiles. Theo asked, “Will leveraging rich personal data be the new differentiator?”
Experience-Focused Companies—and Those Failing to Make That Shift
The companies that do the best job of shaping complete experiences—rather than providing only a single product within a larger ecosystem—will be the most successful. As Theo pointed out, “Brands are no longer only defined by logos, slogans, and artifacts, but by shaping personalized experiences.”
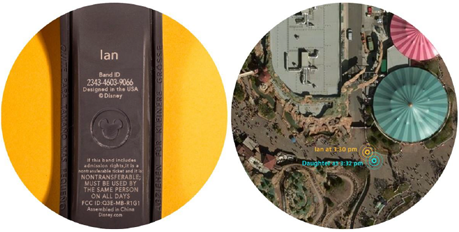
Theo used Disney as his example, saying, “Brand equity is translating into brand trust and re-imagining of the ‘Disney Magic,’ as park guests are sharing more personal data than ever before,” as is depicted in Figure 4. Theo calls this “Disney’s Digital Oil.” Disney has invested a billion dollars in their next-generation experience.
Figure 4—Brand trust translates to sharing personal data
Digital transformation is reshaping all businesses. Theo said, “Hyper-connectivity creates hyper-disruption as industry boundaries blur, partners become competitors and vice versa, and ecosystems emerge as the critical advantage.”
“The digital revolution started in the industrial-media-entertainment complex, and we get to decide where it goes from here,” suggested Theo. Virtually every year, industries fall victim to disruptive technologies that provide better experiences. Theo shared examples from several industries, including newspaper publishing, telecommunications, brokerages, music recording, bookstores, video rentals, and big-box retailers. Again and again, on observing such technology transformations, companies say, “It won’t happen to us.” But, it usually does. As Theo said, “The era of the widget winner has shifted to the era of the digit winners.” For example, consider the shifts from Borders to Amazon, Blockbuster to Netflix, Kodak to Shutterfly, and Nokia to Apple and Google. Successful companies no longer provide value through a single product, but through a complete digital experience.
Theo cautioned that many companies are not prepared for such shifts. “Many firms are configured for the past and [are] not unleashing their potential value. Many will face an extinction event unless they adapt.”
Transformational Industry Trends
“A new type of digital enterprise is emerging. New technologies are transforming work,” Theo told us. We are seeing “transformational industry trends … all around us:
Social computing
Mobility
Advanced analytics
The cloud”
Consumers have greater power than ever before. Even in conservative businesses such as banking, savvy CIOs are recognizing the need to shift rapidly. Take for example, Simon McNamara, the CAO of RBS, who said, “Advances in technology and shifts in customer expectations show no signs of abating. They bring in their wake both disruption and opportunity. We need to recognize that banking is a digital business.”
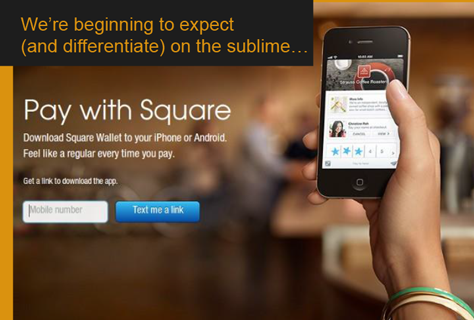
Theo shared a great example with us, comparing Square, an emerging technology and experience shown in Figure 5, with physical ATMs like that shown in Figure 6.
Figure 5—We expect the sublime Figure 6—But still get the ridiculous
As consumers demand superior user experiences, we are seeing an accelerating shift from products that are designed by engineers to products designed by designers.
The Internet of Information
As UX professionals, we have the opportunity to mine the vast IoI (Internet of Information)—as well as the IoT (Internet of Things). Theo asked, “Can user experiences be tailored around digital footprints?” As Figure 7 shows, by leveraging personal information, we can curate user experiences and define new products on the basis of newly discovered economics. Using this information, “the digital world can create more authentic experiences, build affinity, [and] externalize values,” said Theo.
Figure 7—Creating user value based on digital footprints
“Market leaders are recommendation algorithm champions—our digital guides and curators,” said Theo. He spoke about some companies where massive quantities of personal data have helped inform them about business opportunities. Companies that have taken advantage of this data have achieved success much more rapidly than their competitors. These companies have shifted their mindset—for example:
Amazon has driven 35% of its revenue by rethinking “always be closing to always be suggesting.”
Netflix has progressed from “personalized, curated, in-context” content to “always be recommending.” And executives at Netflix knew that the hit TV show House of Cards would succeed well before launching its first episode. Because they knew their users’ interests and love of certain actors and types of drama, Netflix could predict the show’s success. The company has produced not just a TV show, but a curated experience that is based on their understanding of their users.
Pandora can use our musical tastes to connect us to political candidates. They have learned, for instance, that listeners who like Garth Brooks tend to vote Republican, and listeners who like Madonna tend to vote Democrat. If you like Jimi Hendrix, chances are that you like science fiction. Plus, a person’s taste in music predicts their intelligence. (It should come as no surprise that people who love Justin Timberlake’s music have a lower IQ, and those who love Norah Jones’ music have a higher IQ.) The point is that even people’s music libraries provide rich customer insights.
Theo suggests that we, as UX professionals, must discover such insights and use them to define rich, new user experiences and realize opportunities for innovation.
Rethinking Product Design
Theo suggested that business stakeholders need to take a step back to “rethink product design and create a beautiful user experience.” He identified five key starting points and related insights for business leaders:
“Engage, communicate, and interact in a simple, delightful way. Customers are increasingly demanding. [They want] world-class interface design [with a] modern and sleek appearance, … quality, [and] up-to-date content…. Businesses that don’t have the design capabilities in house succeed by partnering with world-class design firms and embracing the kind of deep collaboration and partnerships necessary to make great products and services.
“Organize your business and online user experiences to work seamlessly across every touchpoint. Customers are increasingly demanding. [They want] to flow easily between the digital and physical worlds [and] to bridge devices and channels with no borders. If retailers once had to first engage customers with a warm greeting, they now need to engage them before the first salutation, as they approach each product in the store.
“Communicate in a consistent and relevant tone. Beyond consistency in look, feel, and tone, relevancy is achieved [by] investment in gleaning … customers’ preferences [and] tailoring targeted interactions accordingly. The first step is to listen to your customers, without making too many preconceived assumptions. When successful, such a process should leave space for new forms of discovery, serendipity, and exploration, as well as targeted suggestions.
“Always strive to anticipate [your customers’] needs, and constantly improve. Leading brands … are constantly improving their offerings [and] offer regular software updates that happen automagically…. Learning how to predict user needs and, often, incorporate the unexpected into a user experience—[for example,] by providing seamless customer support or making the purchase process as easy and effortless as possible—will ensure relevance.
“Earn trust and keep customers. Companies that can make consumers comfortable with the trade-off of sharing personal data for tailored services will earn their trust and brand loyalty. [To achieve this, your customers] must
be comfortable with exchanging personal data for more curated online experiences
entrust [a company with] storing financial, medical, demographic, professional, and other types of private information
be certain that the value delivered by these experiences significantly outweighs the perceived loss of privacy
Conclusion
As I listened to Theo, I could not help reflecting on the concept of the experience economy, in which the 20th century perspective of making people want things has transitioned to a 21st century approach of creating experiences people want. User Experience—with its focus on users—is the path to success for companies—especially those with a strong digital presence. Those that do not deliver on the experience will fail. The best presentations stimulate seminal thoughts and help me to connect dots that I would not otherwise have connected. Theo’s talk helped me to connect many such dots.
To explore Theo’s presentation in greater depth, take a look at Figure 8, in which you can see his full slide deck.
Designing UX Strategies Based on Ecosystem Thinking
Reviewer: Pabini Gabriel-Petit
Presenter: Sofia Hussain
Dr. Sofia Hussain, shown in Figure 9, began her presentation by posing several questions:
“What is an ecosystem?
“What does ecosystem thinking mean?
“Why should we think about ecosystems?
“How can we draw ecosystem maps?”
Figure 9—Sofia Hussain
Sofia acknowledged that people have some “misconceptions:
Ecosystem thinking is about designing for multiple devices.
Only larger companies need to think about designing ecosystems. (This can be a good approach—even for smaller companies, even startups.)
Ecosystem thinking is very complicated.”
So, to lend clarity to her topic, Sofia provided some definitions to us: An ecosystem comprises “users, the practices they perform, the information they use and share, the people with whom they interact, the services available to them, the devices they use, [and] the channels through which they communicate.” Ecosystem thinking is “the inquiry method used to analyze and understand existing ecosystems [and an] approach for designing new ecosystems based on our understanding of existing ones. More companies are realizing that the future is about designing better ecosystems.” Then, Sofia shared this quotation with us:
“The battle of devices has now become a war of ecosystems, where ecosystems include not only the hardware and software of the device, but developers, applications, ecommerce, advertising, search location-based services, unified communications, and many other things.”—Stephen Elop
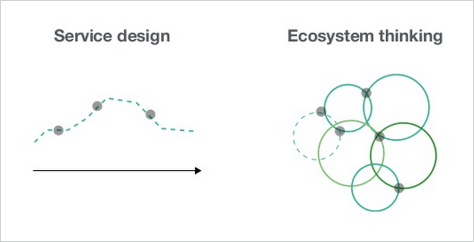
Sofia gave us some examples of companies that are “not good enough at thinking about ecosystems”—Nokia—and that have been successful in thinking about ecosystems—Nike, GOQii, and Cloudwash. Then, she depicted the difference between service design and ecosystem thinking, as shown in Figure 10. “Service design looks at one service you want to improve,” said Sofia. “Ecosystem thinking looks at a broader system, comprising several services.”
Figure 10—Service design versus ecosystem thinking
Example: Finding a New Home
As an example, Sofia looked at the steps involved in finding a new home:
“Search home listings.
“Go to viewings.
“Buy home.
“Sign contract with power and water supplier.
“Decorate, repair, [or] alter [new home].
“Sell old home.
“Move.”
“There are many services that we’ll be using in this process. Services that have been provided by different companies. Focus on the greater goal of the users, not the goal of your service or product,” advised Sofia. “What is the user’s real goal? To find a new apartment or house? To move? To get settled in a new home? The third option offers much greater scope. How should we prioritize? Look for strategic alliances. Define the boundaries of the ecosystem.
“To do this in a strategic way, you need a UX strategy [that’s] based on business goals and what you know about users’ needs and preferences through user research. Don’t look at things in isolation. The UX strategy helps you navigate [and devise a] solution.”
Example: Organizing an Event
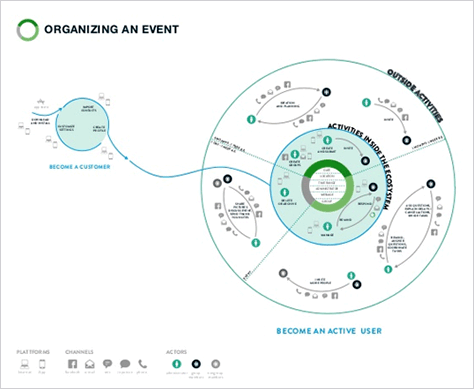
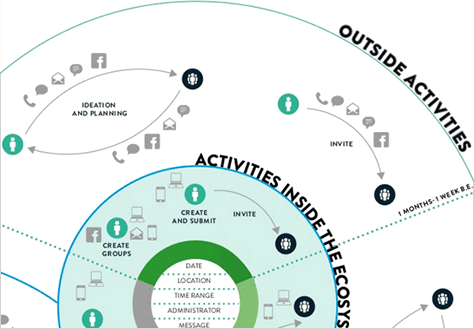
Sofia explored another example in depth: organizing events. Figures 11 and 12 show a representation of an ecosystem for organizing events.
Figure 11—Ecosystem for organizing an event Figure 12—Detail of activities inside and outside the event ecosystem
We could “develop an app for sending out an invoice, but what value would that bring to the user? What is the goal of the user? To send out an invoice or organize something?
“Start by mapping out the steps of organizing events. People exchange ideas about what they’d like to do. One person takes responsibility for sending out invitations. A lot of communication happens. More people are invited. The event takes place. After the event, they share pictures and information about the event.
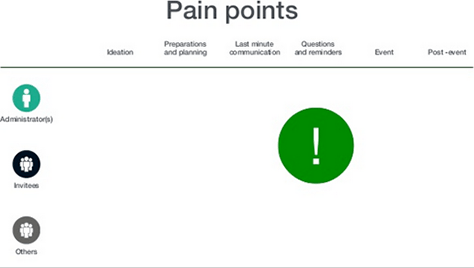
“Map what the client wanted to have in their app. They were focused on features—a system for creating groups, responding to invitations, sending reminders, managing past events. This overview gave us a totally new framework.” The inner circle in Figures 11 and 12 shows what the team thought about throughout the process of integrating ecosystem thinking into the project. As they added content, they “started by identifying pain points—many linked to questions and reminders”—for example, “responses via multiple channels, [cases where] people don’t both reply, [or wondering] who else is coming.” As Figure 13 shows, they identified “clusters of pain points.”
Figure 13—Identifying pain points
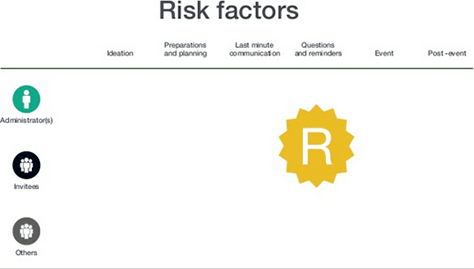
They also identified “risk factors
for each phase [of the process],” as shown in Figure 14. “They needed to look at competitors strengths and weakness and compete or partner [with them]. Pathways
connected several services”—for example, they “integrated a system for booking tickets.” As Sofia pointed out, “You can add a new service rather than a feature. Once you connect [a product] with an ecosystem, it really adds value.”
Figure 14—Risk factors
Lessons Learned
Sofia shared the following additional advice regarding lessons she’s learned about ecosystems:
Create an ecosystem map, then “use the map to develop your UX strategy. UX strategy is not really about developing elaborate maps. It’s about what you can do with maps.
“UX strategy [should consider] target user groups, vision and objectives, the events to focus on, actions needed for reaching your objectives, and how to judge success—[that is,] success metrics. Look at pain points, risk factors, and pathways. Define your goals and how you’ll get there.
“It’s important to start drawing your map as early as possible. Just start putting things up there. It informs your research. No one can draw a map all at once. Whiteboard it.
“Involve all stakeholders. People from different levels in an organization have different viewpoints. If there are disagreements, it’s better to know early.
“Make room for dreams. The map shows a vision. If you limit yourself too much, you’ll miss great opportunities.
“It’s not necessary to design [everything in an] ecosystem … at one time. Do it over time. Each step leads to whole ecosystem.”
Wrapping Up: Ecosystem Thinking and Mapping
“Designing for various devices is just a fraction of all that needs to be considered. Even small startups can apply ecosystem thinking. It does not have to be too complicated.”
Take a holistic approach when looking at “systems and users. Bring added value to users through better user experiences. Even small businesses can use ecosystem thinking to get a competitive edge.”
“The vast majority of maps that have ever been drawn by human beings have scarcely survived the immediate context of their production.”—Tim Ingold
“Build on your map. No matter how much time you spend on your map and strategy, you’ll have to update it on a regular basis. Make changes constantly. Maps and strategy help us find our way.”
As you can see, Sofia created a beautiful slide deck, with fabulous ecosystem maps. My only quibble: centered text is hard to read. To view Sofia’s full presentation, see Figure 15.
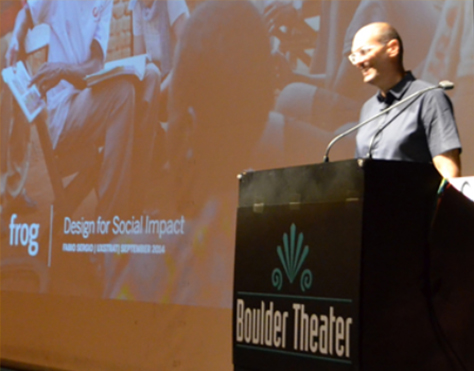
Fabio Sergio, VP of Creative at Frog Design and shown in Figure 16, spoke about how design can improve the human experience and deliver significant societal value. By applying design thinking to the world’s problems, we can make a huge difference. Frog Design is conscientious about giving back to the community, and Fabio had the opportunity to participate in efforts to improve the human experience as part of a giving program.
Figure 16—Fabio Sergio
“If you’re serious about strategy, there has to be a way to measure success—usually business value. But what about social value?” asked Fabio.
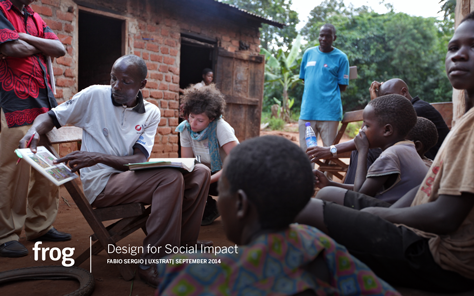
He presented a case study about how Frog partnered with UNICEF to understand and improve the ability of health workers to deliver aid in third-world countries, as shown in Figure 17.
Figure 17—Design for social impact at Frog
Avoiding Stakeholder and Client Confusion
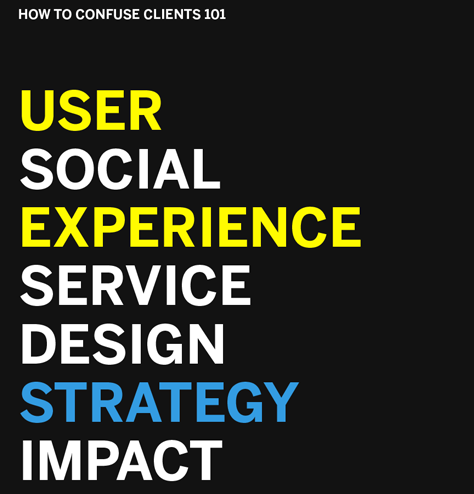
Before jumping into his main topic, Fabio touched on another topic that many at UX STRAT 2014 spoke about, pointing out that, when UX professionals use different, cognitively complex terms to refer to the same thing, we confuse our stakeholders and clients. I couldn’t agree more. As Figure 18 shows, we use combinations of terms such as user, social, experience, service, design, strategy,impact, and more, leaving our stakeholders wondering what we are talking about.
Figure 18—How to confuse stakeholders and clients
Fabio suggested that many perceive User Experience as promoting a future utopia or blue-sky world that we can never reach, which further alienates our stakeholders and clients. Instead, “what about a present that’s a beta of the future we want to live in?” asked Fabio.
He made the point that User Experience can be about something more relevant than envisioning a utopian world, on one hand, or about just saying to our clients, “Let’s change the font to Helvetica, and change that letter from an S to a D, on the other,” as Figure 19 shows.
Figure 19—Is this UX strategy? No!
FrogImpact: Helping Health Workers to Aid Third-World Countries
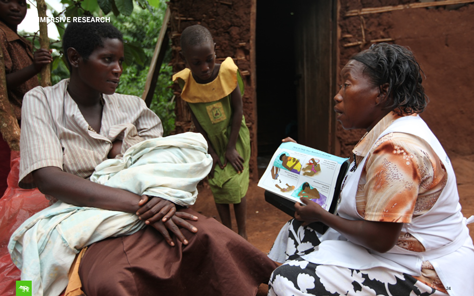
Fabio described the passion that Frog Design brings to their work and talked about some of the FrogImpact projects they’ve done to help communities around the world. Their goal is to solve complex human challenges. So Fabio and his team asked this question: “What if some of these complex issues could be mitigated by improving the human experience of systems and solutions?” Working with UNICEF, a long-standing partner, they developed the concept of Backpack Plus. Their goal was to bring a systematic approach to empowering community health workers to save more lives. The Frog team engaged in a human-centered design project to do just that and conducted immersive research, as shown in Figure 20.
Figure 20—Immersive research
They also consulted with and leveraged the expertise of locals to understand the challenges that health workers face in reaching patients and carrying the tools that they need with them. When treating patients in third-world countries, there are often great geographic distances between clinics and their patients. They must often travel to patients on foot, which presents a significant challenge. Fabio’s team traveled to remote villages and noticed that health workers were hefting heavy boxes of supplies like that shown in Figure 21 across many miles in arid geographies.
Figure 21—Typical aid worker health kit
Using Storytelling to Understand Context
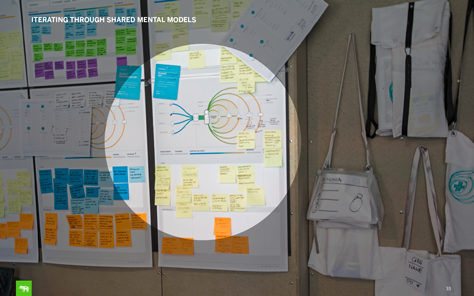
They used storytelling, encouraging the local people to describe scenarios of both successes and challenges that they encountered in providing health care. Once Fabio’s team had observed, interviewed, and heard stories from numerous health workers and other locals, they engaged in multi-partner workshops to brainstorm possible solutions to the challenges these health workers faced. As shown in Figure 22, they then defined mental models to help them understand the context of aid workers in the community and the larger health system, including health centers, suppliers, tools, diagnostic tools, and enablers.
Figure 22—Initial mental model formulation
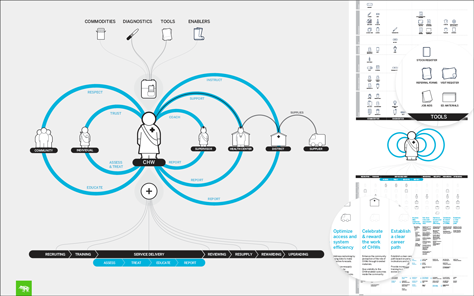
This effort led the team to define a framework for a solution they called Backpack Plus. “We designed all the key assets needed around the community workers’ workflow,” said Sergio.
Figure 23—Mental model for envisioning the Backpack Plus Framework
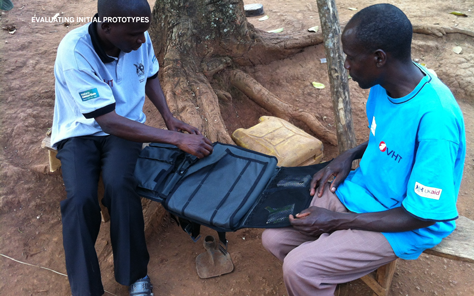
Prototyping to Evaluate Proposed Solutions
“A lot of knowledge resides in reports, [but] prototypes embody knowledge,” said Fabio. The team crafted a prototype of the proposed solution, and took it into the field, where aid workers could test it in practice.
Figure 24—Testing the prototype
By engaging in human-centered design—focusing on the community as the user—participatory research, and in-field prototyping, this team was able to introduce solutions that gained acceptance under complex social and geographic conditions.
So many solutions for community health workers had failed in the past, because the teams that devised them had failed to understand the invisible forces that hold such complex systems together. Through humility—they knew they did not have the answers themselves—empathy in observing and listening, and shared culture, they were able to introduce a solution that activated a community of health workers.
Using Contextual Understanding to Create Value
“Never underestimate the power of design to show things that are not easy to see,” said Fabio. He told us that working in a pre-Internet environment requires tremendous patience, tenacity, and optimism. Earning the trust of the local people and aid workers takes time. As designers, we need to understand the contexts in which we work, so we can gain an accurate and highly contextual understanding that ensures we deliver value.
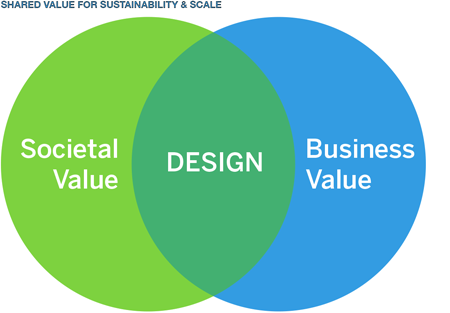
Fabio’s position is that doing good is good business! He made the important point that systems that we intend to help people must be sustainable. So there must be shared value between societies and the businesses that provide the assets. Fabio suggested that design can deliver this shared value by helping us to understand the hidden forces within each system and find solutions that truly create value for both society and business, as illustrated in Figure 25.
Figure 25—Design creates shared value for businesses and society
“When the system is the experience, the experience is a shared asset,” Fabio said, then suggested that, when the experience is a shared asset, “we had better have a strategy to choreograph it.” You can have a look at Fabio’s entire presentation in Figure 26.
Rich Warnaka, who is Manager of User Experience at Cabela’s, began this talk by pointing out that Cabela’s is a multi-billion dollar company whose business strategy has relied on gathering massive quantities of user data. The core problem that the UX team has confronted is how to transform Cabela’s into a user-centric company. At Cabela’s, User Experience has gone through many iterations since they began building the team from the ground up. Rich brought in UX consultant Dan Saltzman of EffectiveUI to help him make User Experience a strategic part of the infrastructure at Cabela’s.
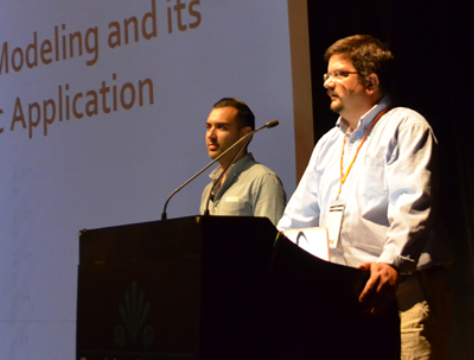
Their presentation centered around one of their key strategic activities: devising ways in which UX professionals can apply behavioral modeling strategically to improve customer satisfaction and retention—thus, increasing the value of User Experience to an organization. Figure 27 shows Dan Saltzman and Rich Warnaka presenting.
Figure 27—Dan Saltzman and Rich Warnaka
Rich first posed these three questions, which encapsulated their presentation:
Why employ behavioral modeling?
How has behavioral modeling helped provide a strategic focus?
How does behavioral modeling augment and complement other user research methods?
Converting Cabela’s from Data Driven to Customer Focused
Cabela’s massive amounts of user data tell them what users do, but their challenge is that they do not understand why they do it. Rich realized that he needed to convert Cabela’s from a data-intensive and data-driven company to a company that understands why customers do what they do.
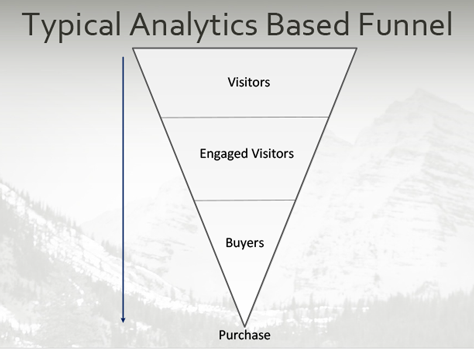
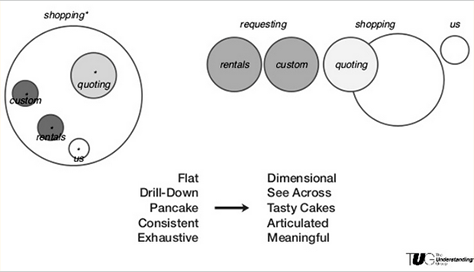
Rich presented a typical analytics-based funnel, shown in Figure 28, in which a subset of visitors become return visitors, and a subset of return visitors become buyers. “This model is great for some things, not very good for other things. All ecommerce sites use it. The problem: It’s very linear, but shopping isn’t always linear.”
Figure 28—Typical analytics-based funnel
By looking at Cabela’s data, Rich had learned that—instead of using a linear, analytics-based model—companies need to take into account the ways in which consumers actually shop and recognize that shopping is not a linear process. Moreover, there are many post-purchase behaviors that are also important. Rich and Dan realized that they needed to discover everything that factors into a shopping process; that it’s important to support all shopping behaviors, not just the typical, linear shopping behaviors. They also needed to discover other roles in the shopping process.
Behavioral Models Describe Actual Behavior, Not Ideal Behavior
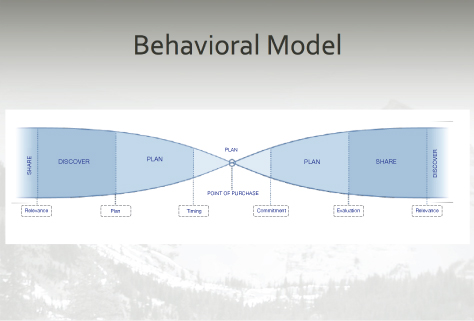
To discover and understand actual user behavior patterns, they needed to engage in behavioral modeling. “The behavioral model that we came up with was an epiphany for the organization,” said Rich. Figure 29 shows the model.
Figure 29—Behavioral Model Framework
Dan talked about how he and Rich had devised this behavioral model to take all shopping behaviors into account. He began by saying, “We wanted to learn what’s beyond the funnel. … Great personas are only a tactical part of the equation. In looking at an ecosystem, behavioral modeling is more effective.” By learning what was happening outside the typical funnel, they gained an understanding of how they could engage users more holistically throughout their ecosystem.
Of course, it’s often possible to reduce disparate behaviors to similar patterns, and these patterns can potentially be circular: Customers determine the relevance of a type of product to their life, discover a product that meets their need, develop an intention to purchase it, and plan the purchase. Once the timing is right, customers commit to a purchase. This point of commitment leads to further comparisons and evaluations. Customers share their thoughts on the product they purchased, which, in turn, aids discovery for other customers.
Rich made the important point that companies must support the point in the behavioral model where customers actually are rather than where the company would like them to be. For example, sending a follow-up email message to a customer in discovery mode might actually drive the customer away rather than inducing him to make a purchase now.
Behavioral Models Help in Designing All Customer Interactions
Dan told us, “You can employ such behavioral models in designing all parts of a company’s interactions with its customers, including the structure of its Web site.” When such behavioral models drive a Web site’s structure, this allows a company to integrate learnings from the copious amounts of data it has gathered into the design, which ultimately leads to better sales.
Dan presented an example of an actionable persona, which his team used in applying the behavioral model to other research techniques and deliverables. The persona the team created was “Hal the Hunter.” They tried to determine how Hal discovers new products—whether in a catalog or online. They wondered, “How does Hal share the products he discovers? Does he write a review online, or is he more of a word-of-mouth kind of guy?”
Though they created personas, even the best personas are only a part of the total equation. To understand users’ interactions throughout the total ecosystem, they needed to create complex behavioral models. “The behavioral model allows … a greater depth of contextual inquiry into the where, the when, and the why of their customers’ purchasing behavior,” said Dan.
Rich and Dan build a conceptual model that showed shopping is a lot like hunting—an apropos metaphor for Cabela’s. “Shopping is a lot like hunting,” said Dan. “Shoppers do their research, then they track that item over time, like they do their prey. They make sure they have the right item—or prey—then they kill it—or buy it—to use shopping terminology. But they’re not done when they purchase. They also show off their catch.” A linear shopping funnel does not consider all of these aspects of the hunt.
I thought this was an awesome example to use for Cabela’s, an outfitter for hunting and other outdoor activities. Rich and Dan considered their internal stakeholders in the same way one might understand a user, and they presented their data and insights in a way their stakeholders could rally around.
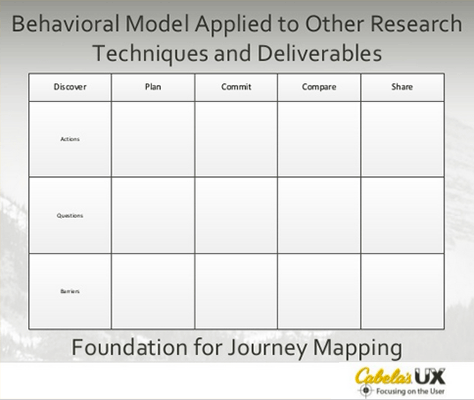
Behavioral Models: A Foundation for Journey Mapping
“This model disrupted long-held beliefs. It became a framework we can use across many different things—looking across many touchpoints,” said Rich. Next, Rich talked about how behavioral modeling can serve as a foundation for journey mapping. As shown in Figure 30, the total behavioral model that Rich and Dan created comprised the following steps: discover, plan, commit, compare, and share. Rich discussed what actions, questions, and barriers exist at each step in this behavioral model.
Figure 30—Behavioral model as a foundation for journey mapping
In concluding, Rich made it clear that he feels behavioral mapping is just the beginning of a discovery process, and there are innumerable ways in which to build upon behavioral mapping in creating an effective user experience. In the end, this effort changed the focus of the overall product team to comprehend the total customer experience, and their surprising insights helped place User Experience in a strategic position within the company.
Creating behavioral models that demonstrate why users engage with Web sites in the many different ways that they do helps companies to make decisions that result in a much better conversion rate. Rich and Dan have found working at Cabela’s to be a deeply rewarding and fun experience, and they have enjoyed leveraging behavioral modeling to win a seat at the strategy table for User Experience. To see their presentation, take a look at Figure 31.
Figure 31—Rich Warnaka and Dan Saltzman’s presentation
Making Sense of the Madness: UX Strategy to Kick Off NCAA March Madness Live
Reviewer: Jim Nieters
Presenter: Lisa Estrin
Lisa Estrin, shown in Figure 32, is UX Lead at Turner Sports and delivered a high-energy, fun presentation about how she applied UX strategy to help define the strategy for the March Madness program that Turner Sports broadcasts each year. To provide some context, March Madness is an annual college basketball tournament that starts with 64 teams, works its way down to the Final Four; then, finally, to the NCAA Basketball champion.
Figure 32—Lisa Estrin
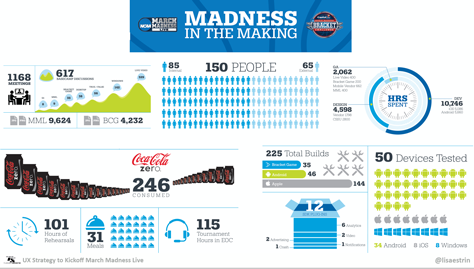
Each year, the tournament starts in March and runs into the second week of April. Of extreme significance to this effort is the level of, well, madness that sports fans bring to the March Madness event. During March Madness, people—mostly college students, but other fanatics as well—paint their faces, dress up, and engage in what might appear to outsiders to be hysterical behavior, in support of their teams. And, as shown in Figure 33, it takes a big development team to put together the program.
Figure 33—2014 March Madness in the making
As Figure 33 shows, for the 2014 March Madness, the development team
consisted of 150 people
spent 4,598 hours on design and 10,746 hours on development
built an application that functions across iOS, Android, Windows 8, Windows Phone, xBox, and Amazon devices—delivering more products and streaming options each year
tested the application across 50 devices
executed 225 software builds
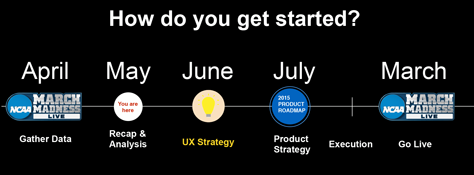
By almost anyone’s standards, this is a large project. While the event itself lasts only about one month out of every calendar year, Lisa told a funny story about how much time it takes to put together the event: When she was talking with a colleague about all of the cool methods that she and her team were using to deliver a stellar experience for fans of March Madness, this colleague floored her asking the question, “Yeah, but what do you do all year?” The fact is that it takes a full year to gather and analyze data, internalize insights, craft new strategies, and build the necessary capabilities in an ever-evolving world of sports entertainment. Figure 34 provides an overview of their development schedule.
Figure 34—Delivering March Madness takes a massive effort
Including UX in March Madness Strategy
Historically, the Turner March Madness team has delivered a product roadmap in July for the program they intend to run the following March, giving the organization time to specify the details of what they would build, then build the assets. Lisa successfully inserted UX strategy into the overall program plan.
During the first two months of the project, the team conducted a recap and analysis of the previous program, which had used numerous data-gathering, analysis, and reporting methods, including the following:
desktop eyetracking studies
audience segmentation studies
push IO analytics reports
market analysis and trends
refined business goals and objectives
stakeholder interviews
app store reviews
customer service reviews
vendor recaps
competitive analysis
usability studies
analytics reports
product and feature evaluation
product brief development
product roadmap
Apple and Google conferences—for operating system and platform updates
product design sprints
Lisa felt that all of this was very confusing and a bit of a free-for-all, so she and her team did three basic things to bring structure and add value to the overall project:
They created a map of what the larger team was doing.
They created a central dashboard to provide access to the massive amount of data that they had collected.
They showed their work.
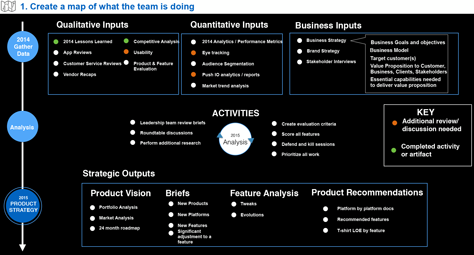
Creating a Map of What the Larger Team Was Doing
By creating a map showing the activities of all cross-functional team members throughout the project, as shown in Figure 35, Lisa ensured that everybody had a clear understanding of who did what and what work the team had already completed versus what they still needed to do.
Figure 35—Mapping what the entire team is doing
Creating a Central Dashboard for All the Data
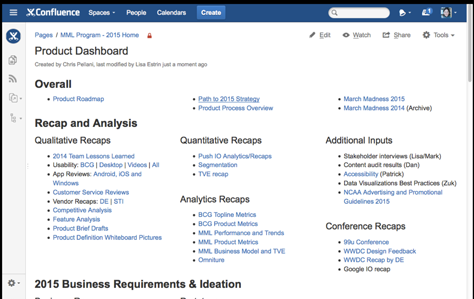
Though the Turner March Madness team typically collected a massive quantity of data, nobody could find data when they needed it. So the UX team crafted a comprehensive Product Dashboard, shown in Figure 36, where anybody on the product team could find any data they needed, as well as other relevant documents such as product requirements documents.
Figure 36—Product Dashboard
Showing the UX Team’s Work
Lisa found that, by making their research, analysis, and designs available to other members of their cross-functional team, the UX team spent less time defending the data. The fact is that, in many companies, stakeholders across teams have opinions that they think matter. When a UX team can point to their data with confidence and suggest that team members review it themselves, the benefits are that the data
drives the product team toward data-driven decision making rather than opinion-based decision making
helps build the UX team’s credibility
enables the UX team to communicate a clear vision
aligns the troops around a single vision
provides transparency to the UX team’s process
In addition, anytime someone questioned a decision or a statement from the UX team, Lisa’s team members could point to the data and remind the product team that what matters is serving users, not people’s random opinions.
In Summary
As on every project, Lisa’s team did the necessary research and design work. But by helping to organize the work of the product team, creating a dashboard where everyone could find the data they needed, and showing the UX team’s work, they raised the visibility of the UX team from a tactical to a more strategic position. You can see Lisa’s full presentation in Figure 37.
Strategy and Structure: Doing It Right, and How You’d Know
Reviewer: Pabini Gabriel-Petit
Presenter: Dan Klyn
Dan Klyn, shown in Figure 38, is from Michigan, which he touted as “the epicenter of progressive culture.” In introducing his talk about how structure supports strategy, Dan showed us photos of some remarkable, modern architectural structures. His point? Aesthetics are tactical. But together, strategy and tactics equal structure. Again showing us several photos, this time of some mundane buildings whose structure has nothing to do with their use, which he referred to as “decorated sheds,” Dan said, “If you look at the structures we make, read them, understand them, how do you know if you’re doing this right? Be sure that the thing you’re making would work in the next, larger context.” The next context might be space travel. “There are structures that result from strategy. Connect with what a business is trying to accomplish.”
Figure 38—Dan Klyn
What Is a Good Structure
Next asking, “What’s a good structure?” Dan observed, “Structure in nature just occurs.” He quoted Richard Saul Wurman, who said:
“There is no right way.”
“But there are good ways to line up strategy and structure,” noted Dan. “Sometimes a difference in scale means a difference in kind—big, hairy messes of information” like that shown in Figure 39.
Figure 39—A big, hairy mess of information
Steps Toward Good Structure
Dan outlined the following four steps to good structure:
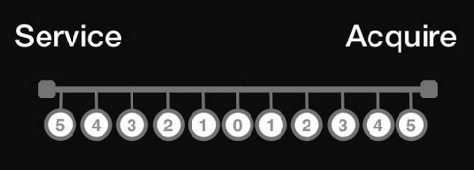
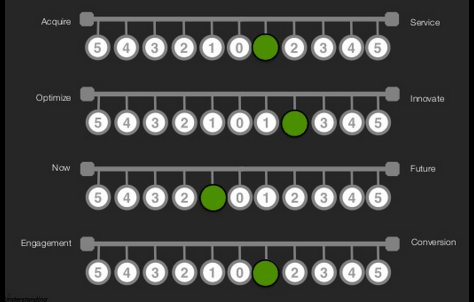
Map intentions. There’s a “tendency to see points of intention coming together,” remarked Dan. “I can see how strategy will be rendered in design,” but instead of rushing to solve a problem, “work toward agreement, not consensus. The way we choose to organize what we mean starts to build structure.” For example, Figure 40 maps a range intentions from service to acquisition, and Figure 41 provides other perspectives on structure—optimize versus innovate, now versus the future, engagement versus conversion.
Figure 40—Mapping a range of intentions Figure 41—Mapping a variety of intentions
Dan shared a pithy quote from Richard Saul Wurman:
“The classic, pervasive seduction to designers has been to find a solution instead of the truth.”—Richard Saul Wurman
Control meaning. “Controlling for meaning is really hard,” Dan told us. “ One form of control of meaning that’s within grasp is to audit whether the arrangement of stuff is meaningful—auditing it to understand what it means.” As Dan again quoted Richard Saul Wurman, I started believing that Wurman is a bit of a hero to him. Here’s the quotation:
“The creative organization of information creates new information.”—Richard Saul Wurman
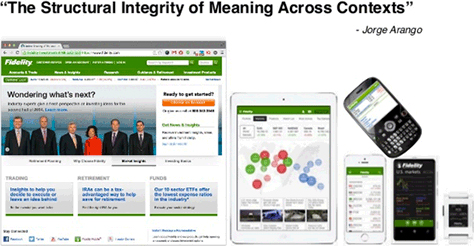
Another way of controlling meaning, as Jorge Arango demonstrated in Figure 42, is to ensure “the structural integrity of meaning across contexts.”
Figure 42—Structural integrity of meaning across contexts
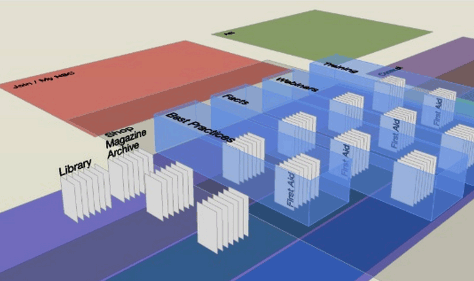
Create dumb models. Alluding to Peter Merholz’s talk earlier in the conference, during which Peter discussed the double diamond model, Dan advised, “Don’t show prototypes too early in first diamond. You’re making an argument for how parts come together. Models are not about how a building is made, but what its structure is. We’re talking about what would be good.” When it comes to models, “the rhetorical is greater than the pictorial.” Figures 43 and 44 show examples of models.
Figure 43—A model for ecommerce Figure 44—An IA diagram—“a fancy dumb model in 3D”
Dan showed that places can be made of information. For example, people spend 40 plus hours a week on Facebook, a place of information.
Use a structural vocabulary. When using a structural vocabulary for design, you decide “what kinds of structural approaches to take,” said Dan. As an example, Dan showed us some screenshots of travel apps on the iPhone that share a similar vocabulary. You can also devise “a language for how to accomplish strategy.”
Dan talked about “structure as a duality, [in which] certain structures are ducks”—that is, the structure works for what you’re doing—and “others are decorated sheds—[and] signage lets you know what a building is about.” As an example of a duck, Dan showed us the photo of an I.M. Pei building in Boulder in Figure 45. It’s at the end of Table Mesa Drive and, during my visit to Boulder, Laurie Lamar, a local friend, showed it to me. Unfortunately, as Dan told us, “The way they do research today is inhibited by the structure of the building. Their work is inherently cross-disciplinary, and the building comprises separate tower that isolate teams, so they fight the building.”
Figure 45—National Center for Atmospheric Research, an I.M. Pei building that started out as a duck
In contrast to a duck, “a decorated shed can accommodate all kinds of usage over time,” said Dan. Figure 46 shows an example of a decorated shed.
Figure 46—Chautauqua Auditorium, a decorated shed
In Conclusion
“What does this have to do with what we do?” asked Dan. Some examples of ducks include the sites for Virgin America and Square. “PayPal copies Square, but what PayPal does is decorate their shed.” When new features launch, “they can redecorate. It’s tricky with digital because, unlike with buildings, you can’t count on what you’re looking at. We have the ability to present different structures in different contexts”—for example, “mobile versus desktop.”
Moving from structure to meaning to intent, there are “four ways to traverse this,” said Dan. “Often we move from intent to structure, skipping the meaning between. If we could make structures that align really closely with strategy, the things we make could be legible.” We could make structures specifically for a purpose.
The Making of a Digital Strategy: A Survivable Plan for Creating Unified Digital Experiences
Reviewer: Jim Nieters
Presenter: Bill Rattner
Bill Rattner, shown in Figure 48, is Director, Digital Strategy, at CapTech Ventures and described how he and his team created a digital strategy for their large client company, Dominion, in just eight weeks, as part of a larger capital project called Sitecore. The main point of his presentation was that—not only did they create their strategy rapidly—other UX leaders can follow in their footsteps and create their own digital strategy rapidly, too. Plus, they aligned their entire organization around their UX-defined strategy, and so can you.
Figure 48—Bill Rattner
Bill’s presentation answered several questions about digital strategy, including the following:
What is a digital strategy?
Why is it important?
How do you implement a digital strategy?
Why Have a Digital Strategy?
Answering the question “Why have a digital strategy?” Bill said, “Not having a digital strategy is potentially the worst strategy decision a company can make.” A digital strategy defines the vision, goals, opportunities and initiatives that are necessary to maximize the business benefits of digital initiatives to an organization. If your company has a digital presence, it needs a digital strategy.
Talking about how to implement a digital strategy, Bill pointed out that, while it is “incredibly hard,” it boils down to three main activities:
“Focus on the right audiences.
“Develop end-to-end processes, systems, and governance to streamline business operations.
“Put the technology in place to support user engagement.”
Next, Bill asked: “Why are digital communications important and why do we need a digital strategy?” In answering this question, he said, “Today, digital is a participatory layer of all media that allows users to self-select their own experiences and affords companies the ability to bridge media, gain feedback, iterate their message, and collect relationships.”
Bill also posed the question: “How can we leverage digital technology to create true competitive advantage and make us more relevant in the market?” After all, creating such a competitive advantage is the reason companies are in business. In answer, he told us, “A digital strategy allows companies to understand the who, what, when, and where of listening and responding to consumers, bridging brand experiences, iterating offerings, and collecting and activating consumer relationships in order to accomplish an actionable and measurable objective.”
Bill laid out several benefits of having such a digital strategy in order to provide value for customers, employees, the brand, and shareholders, as follows:
benefits for customers:
Customers feel more connected, favorable, and satisfied.
Customers are empowered—and in Captech’s case, were promoters of their client Dominion Resources.
benefits for employees:
Employees have a shared vision of the customer experience.
The digital strategy reduces redundancy in digital efforts.
The digital strategy helps in prioritizing efforts and determining high-value projects.
benefits for the brand:
Enables a company to build trust.
Brand cohesion improves customer recall.
The company receives credit for philanthropic and community involvement.
benefits for shareholders:
Satisfied customers cost up to 25% less to serve.
Self-service has a direct impact on the bottom line.
Satisfied customers generate up to 30% more revenue in retail and non-regulated utilities that have higher CSAT scores and bond ratings.
Utilities with higher CSAT scores have stronger regulatory relationships.
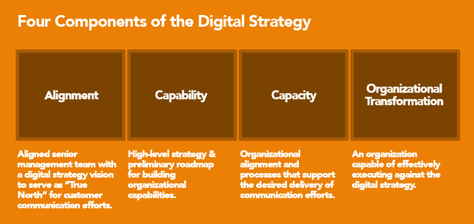
The Main Components of a Digital Strategy
Bill outlined the four main components of a digital strategy, shown in Figure 49, and discussed how his team employed them to solve problems effectively for CapTech:
Alignment
Capability
Capacity
Organizational transformation
Figure 49—Digital strategy components
For a “digital transformation,” said Bill, “we need executive sponsorship from the top.” These steps highlight Bill’s strategy of engaging customers across all channels and points of interaction with the company, so customers’ experience with the company feels seamless to them.
The Nine Steps of a Digital Strategy
“Digital strategy is the process of specifying an organization’s vision, goals, opportunities, and initiatives in order to maximize the business benefits of digital initiatives to the organization,” said Bill. Then, he laid out the strategic work his team did in nine steps:
Research and analysis
Strategic priorities
Challenges and opportunities
Guiding principles
Outcomes
Determining initiatives
Roadmap
Action plan
Governance model
The following sections describe each of these nine steps:
1. Research and Analysis Phase
During the Research and Analysis phase, Bill’s team gathered requirements through stakeholder interviews and identified the company’s digital inventory as it existed at the time. They evaluated industry trends to ensure that the company’s digital strategy aligned with them. Finally, they built a business case—determining problems and opportunities as they presented themselves and envisioning what success would look like in Dominion’s case.
2. Strategic Priorities Phase
During the Strategic Priority Phase, they identified executive sponsors, evaluated customer experience scores, brand clarity, community awareness, corporate culture, process, skills, measurement, and technology. Bill told us, “The strategic priorities were elicited through stakeholder interviews and are the foundation of what drives Dominion Resources’ overarching company mission and goals. Any initiative proposed through a digital strategy should align to the priorities of the company.”
The nine priorities that the team identified should be the key areas of focus if the digital strategy is to be successful over the course of the next five years. It is important to note that, while their digital strategy was about technology, it was also very much about change management, organizational alignment, and a rededicated commitment to serving customers in ways that digital communications uniquely afford.
3. Challenges and Opportunities Phase
After interviewing stakeholders across Dominion Resources and looking at their strategic priorities, the team identified eight challenges and opportunities as the most important priorities. By focusing on the specific needs of Dominion, they were able to customize initiatives and define outcomes that would deliver the highest business value. Bill found it interesting that only two of the challenges that his team faced were related to technology—the rest focused on the human side of their strategy—for example, budgetary concerns and organizational fragmentation.
4. Guiding Principles Phase
During the Guiding Principles phase, they identified four principles to guide how they plan, make decisions, and allocate resources to appropriately leverage the use of technologies. “The guiding principles are based on analysis and distillation of Dominion’s strategic priorities, organizational opportunities, and trends in the industry landscape,” said Bill. Their four guiding principles were as follows:
We view Dominion information as a resource to be made available to advance our commitment to transparency, disclosure, and engagement.
We harness technology to provide easily accessible, responsive, and cost-effective services.
We value, recognize, and facilitate the right of our customers’ engagement.
We ensure that our customers are not unfairly disadvantaged because of the digital divide that technology creates.
5. Outcomes Phase
“Outcomes represent the high-level strategic goals for the Dominion Resources digital strategy,” said Bill. These strategic goals derived from an analysis of communication and industry trends, as well as the alignment of these trends with Dominion’s unique challenges and priorities. It is important to align digital project initiatives with the desired digital strategy outcomes. They defined their outcomes as follows:
Provide an excellent customer experience.
Build strong brand relationships.
Build memorable community awareness.
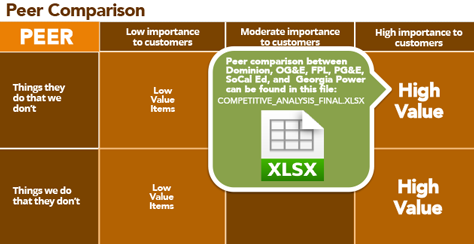
6. Determining Initiatives Phase
“Project initiatives were evaluated through peer analysis, ideation workshops, customer needs analysis and value mapping,” said Bill. As shown in Figure 50, Bill and his team tried to determine what Dominion could do that had the highest value to customers, but competing companies could not do.
Figure 50—Determining what opportunities would deliver unique value
7. Roadmap Phase
During the Roadmap Phase, the team presented their recommendations for a five-year strategic prioritization of initiatives, which were based on value to the organization and its customers. The roadmap also took into account the available resources and upcoming Sitecore implementation.
8. Action Plan Phase
The action plan identified success targets and measurements and represented an example delivery method for executing on an identified digital strategy initiative.
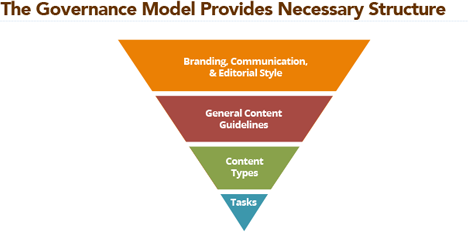
9. Governance Model Phase
A governance model provides the necessary structure for the implementation of a strategy. Bill represented their governance model as an inverted pyramid, progressing from branding, communication, and editorial style, to general content guidelines, to content types, to tasks. Bill hastened to point out that a governance model is not equivalent to an organizational chart. It results in a collaborative, multi-disciplinary team that spans business units.
Figure 51—Governance model
Execution Can Be the Hardest Part of Strategy
Finally, in a gesture that gave poignancy to his presentation, Bill pointed out that he has not yet accomplished all of his goals for Dominion, saying, “It's going to take organizational change management to get this done.”
In a plan with steps for establishing organizational priorities, identifying challenges and opportunities, determining a desired future state, generating a business case, identifying digital initiatives, and executing digital initiatives, his team’s progress falls somewhere between the last two steps—that is, between identifying and executing digital initiatives. Bill quite helpfully admitted that execution is often the most difficult area of strategy. I hope to hear the results of the strategic initiatives that Bill and his team put in place for Dominion at a future UX STRAT conference.
Bill’s presentation was rich in detail, covering more than his allotted time allowed me to take in. In order for you to fully appreciate the depth of thinking that went into his presentation, I suggest that you peruse his entire slide deck, which is shown in Figure 52. Or read his UXmatters article, “Keys to a Successful Digital Strategy: CapTech Ventures.”
Jim Kalbach, shown in Figure 53, spoke about the application of the Jobs-to-Be-Done (JTBD) framework to UX strategy. In striving to innovate, “some organizations are drowning in possibilities,” said Jim. “With design thinking, there are more Post-its walls of things that will never get implemented.” There’s risk in creating solutions for which there is no market need.
Figure 53—Jim Kalbach
The Jobs-to-Be-Done framework had its basis in the following quote from Clayton Christensen:
“The job, not the customer, is the fundamental unit of analysis for a marketer who hopes to develop products that customers will buy.”—Clayton Christensen
“We need to focus not on demographics, but on what people are trying to get done,” advised Jim.
Companies tend to focus on building brands, segmenting markets, and new product innovation.
“People just need to get things done. They hire products to do jobs for them.” But, all too often, products don’t help customers to get their jobs done.
Using the Jobs-to-Be-Done Framework
The Jobs-to-Be-Done framework comprises the following four steps:
Understand users. This requires interviewing and observation of people performing their tasks. Start with contextual inquiry and primary research.
Map jobs to be done. To understand the jobs to be done, create a map—for example, a mental-model diagram. Jim shared this quotation from Indi Young’s book, Mental Models:
“A mental model helps you visualize how your business strategy looks compared to the existing user experience. Thus, it is a diagram that can support your experience strategy.”—Indi Young
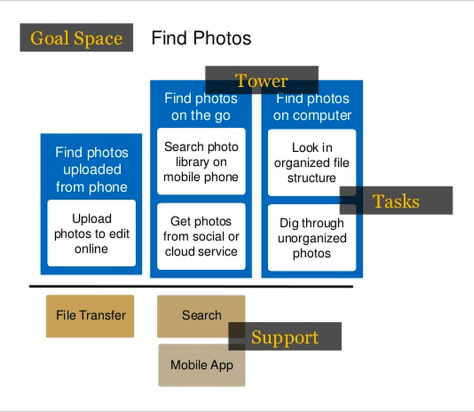
Behavioral modeling is another mapping approach. Map of all the JTBDs that you’ve discovered in your research—for example, the find photos task shown in Figure 54. Organize the tasks hierarchically. Create a goal space comprising task towers. Add the supporting capabilities below, as shown in Figure #.
Figure 54—Mapping a find photos task
Hold a workshop with stakeholders. Assess how well current products and services are meeting users’ needs.
Tasks, towers, and goals are the jobs to be done—and below are the supporting features and current products and services. Map future concepts below the task towers and supporting capabilities. This provides some insights. Maybe there’s a reason for not doing something.
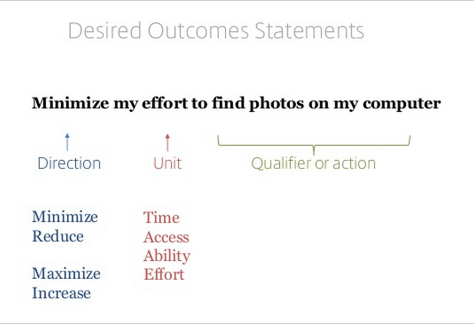
Identify opportunities. It’s necessary to precisely define opportunities. For guidance, Jim recommended that we read Tony Ulwick’s article, “Turn Customer Input into Innovation.” Assess the importance of jobs that need to get done and people’s current satisfaction in getting those jobs done, no matter how or what product they’re using to accomplish their goal. “Innovation always has an unpredictable element to it,” said Jim. Generate desired outcome statements like that shown in Figure 55.
Figure 55—A desired outcome statement
Look at outcomes as measures of success for getting a job done. How are users going to measure success? Start each statement with a verb that indicates the direction in which you want to see movement up or down—for example, minimize or maximize. Next, indicate the unit of focus. What are you trying to move up or down? What’s your goal, qualifier, or action?
Conduct a quantitative desired outcomes survey, asking the following questions for each desired outcome statement and having users rate each of their answers on a 10-point Likert scale:
How important is this to you?
How well is this currently being satisfied?
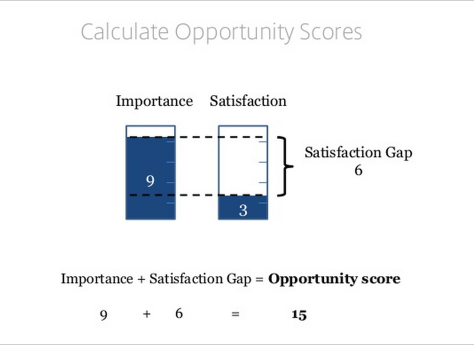
Calculate opportunity scores, using Tony Ulwick’s formula: Importance + Satisfaction Gap = Opportunity Score, in which the satisfaction gap is the importance minus the user’s level of satisfaction, as shown in Figure 56.
Figure 56—Calculate opportunity scores
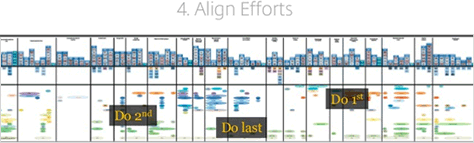
Align efforts. Users’ unmet needs point to higher chance of success in innovation. Focus on areas with higher chances of success and greater opportunity, as shown in Figure 57.
Figure 57—Align efforts
The Lessons Learned
Uptake of this approach was neither immediate nor widespread. It got more interest as Jim continued doing the research, mapping JTBDs, and calculating opportunity scores. The outcomes that were important to Jim included
concepts—“Look at desired outcomes as heuristics: does the concept help or hurt?” advised Jim. Doing this enabled Jim to go deeper into a confined area.
messaging—Address stakeholders’ concerns about uncertainty. Speak to customers’ unmet needs. Use the language of the user throughout. Shift your language to reflect JTBDs—for example:
before—Our automated photo indexing is the best in the industry.
after—Find photos on your computer with less effort thanks to our smart indexing.
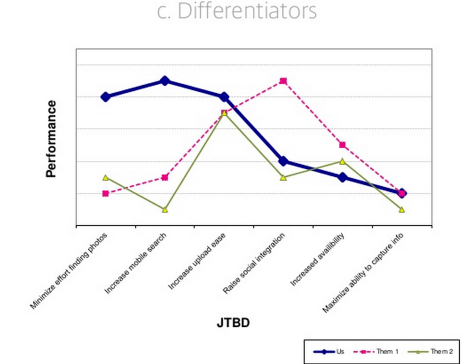
differentiators—Look at JTBDs as differentiators. Ask: how well do we fulfill or satisfy jobs to be done. How do we differentiate from competitors? Look at the relative performance on JTBDs for your own product versus that of your competitors’ products, as shown in Figure 58. This points to a different way of looking at competitors—reframes what a competitor is.
Figure 58—Differentiators
Jim provided an example from Scott Cook, Founder of Intuit, as follows:
“The greatest competitor [in tax software] … was not in the industry. It was the pencil. The pencil is a tough and resilient substitute. Yet the entire industry had overlooked it.”
In conclusion, looking at the market by arenas, Jim shared a Rita Gunther McGrath quotation from her great strategy book, The End of Competitive Advantage:
“The driver of categorization will in all likelihood be the outcomes that particular customers seek (“jobs to be done”) and the alternative ways those outcomes might be met.”
Once you successfully complete these four steps, one more thing happens:
Understand users.
Map jobs to be done.
Identify opportunities.
Align efforts.
Redefine markets.
If you want to see Jim’s entire presentation, have a look at it in Figure 59.
Well Designed: How to Use Empathy to Create Products People Love
Reviewer: Pabini Gabriel-Petit
Presenter: Jon Kolko
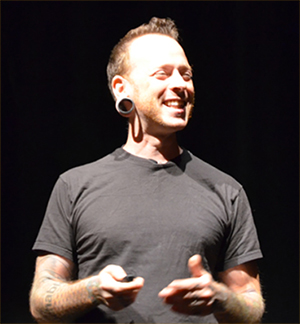
I enjoyed Jon Kolko’s closing keynote. As Director and Founder of Austin Center for Design and author of several books on design, including one with the same title as this keynote, Jon is a thought leader in the UX design community. As shown in Figure 60, Jon’s look makes an artistic statement that reminds me of my days in the music business, where tattoos and earrings are quite usual for men.
Figure 60—Jon Kolko
Jon kicked off his talk by posing several questions:
“Where do great new products come from?
“Is it vision?”—This is the autocratic approach.
“Is it process?—For a long time, I believed this more than anything else. …
“Is it just hard work?—Now, I believe more and more that it’s just hard work.”
Product Management
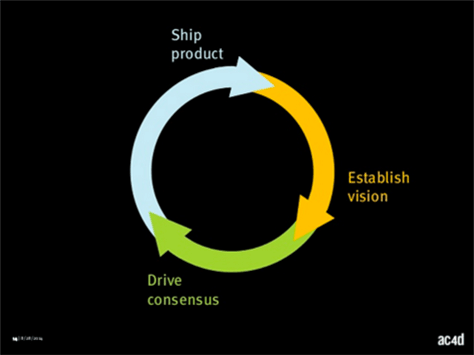
Jon’s answer: “Product management. It underlies all three of those ideals and resonates with designers.” Jon had asked product managers what they did, and as Figure 61 shows, “the cycle looks something like this: Establish the vision—maybe from the top. Do empathetic research. … Drive consensus. You can never escape that need. Things aren’t obvious. They don’t sell themselves. Alignment is the key. Ship product. That’s the hardest part—getting it out the door. Actually getting it into users’ hands.”
Figure 61—The product management cycle
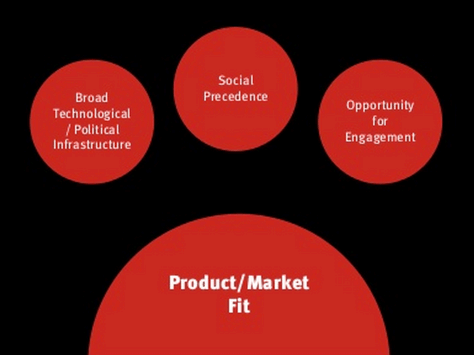
“Product/market fit—jargon for the idea that the world is ready for you. It’s interesting to watch this play out in real time,” said Jon. As shown in Figure 62, this requires
“broad technological / political infrastructure—If, as an entrepreneur, your product requires technology that doesn’t yet exist, it’s difficult to see the value.
“social precedent—Google Glass is weird because we don’t have a social precedent. It’s less weird than before headsets to have physical devices on your face. There’s a social precedent that has to be learned. That takes time.
“opportunity for engagement—You’re actually giving me your attention, which is really rare. I want my products to capture that attention, too.”
Figure 62—Product / market fit
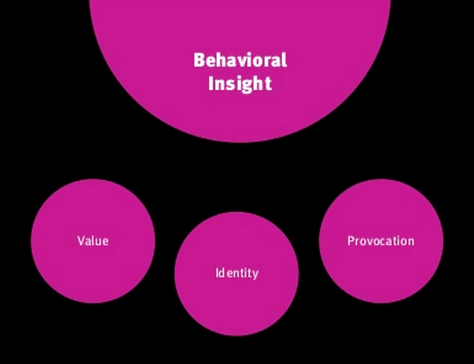
“That’s half the story,” Jon told us. “The other half is behavioral insight, which, as shown in Figure 63, requires
“value—As long as they provide that value, I’m happy. If the value proposition is not fulfilled, I’m pissed. Products have to have promise and have to deliver on it.
“personal identity—People have to see that in your product. Think a little bit about what it would take to create identity in your product.
“provocation”—A rigorous process of “synthesis and interpretation … leads to the development of core behavioral insights—of provocative statements of truth about human behavior that act as the driving force behind new product innovation and engaging design.”
Figure 63—Behavioral insight
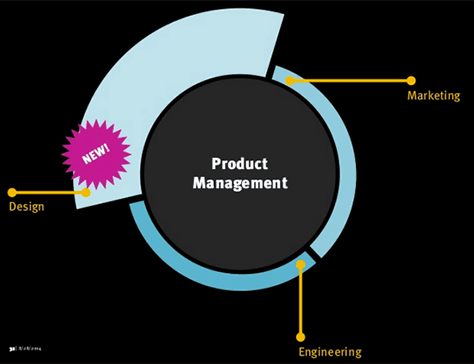
“Product management is starting to be in vogue for [UX professionals],” observed Jon. “Good engineers make good product managers [for technology products]. They focus on capabilities. Brand managers and marketing, too. Where is the trend toward ‘design-led product’ coming from? Designers as product managers are mostly out of Silicon Valley companies working on small products or big social products.” This trend has been getting a lot of press coverage and attention at TedTalks. Figure 64 shows various roles that can take on product management.
Figure 64—Product management
Tactics and Strategy
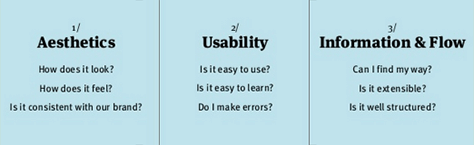
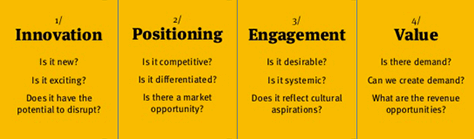
“Design is innovation—a way to differentiate,” said Jon. As Figures 65 and 66 show, design is both tactical—aesthetics, usability, information, and flow—and strategic—innovation, positioning, engagement, and value. At this level, design gets you a “seat at the table.” Jon then asked, “How can I bridge this gap?” The answer: through product management.
Figure 65—Design is tactical Figure 66—Design is strategic
Qualities of a Good Product Manager
“What are the qualities of a good product manager?” In answer, Jon quoted Josh Elman, Partner at Greylock, who said:
“You need to sell, engage, learn, and listen, and get the whole team excited to go do it. You need to be a good storyteller. Great product managers can tell a story about a user, what he is doing in his life today, and what he would be able to do in the future if we just got him the right product.”—Josh Elman
To which Jon added: “The ability to tell stories about an optimistic future. What makes a story good? It’s believable.” Jon also quoted Frank Lyman Chief Product Officer, MyEdu:
“I toggle between my rational brain that says, ‘Here’s what the competition is doing; here’s what the data says the customers want;’ and my emotional feelings that ‘this will have impact.’ No one has said they want this, no one has done it before, but I’m looking at it, and I think it will have impact.”—Frank Lyman
Jon sees this as the “ability to make sense of signals from people and the market.” A product manager must also have “a passion for listening and learning about people [and] curiosity about technology and other disciplines, [be] affable [and have] the ability to work with others—driving consensus so everyone feels heard and feels good.”
The Role of a Product Manager: A Case Study
“So what does a product manager actually do?” asked Jon. To provide us with an example, Jon presented a case study from myEdu, where he was VP, Innovation, Product, & Design. myEdu is a free suite of tools for college students, who can build a profile and connect with recruiters who want to find them jobs. The goals of myEdu users are to “succeed in college, tell their story, [and] get a job.” In presenting this case study, Jon revisited the three stages of the product development cycle that he had laid out earlier.
Establish Vision
This stage comprises the following:
contextual research—Jon’s team spent a lot of time doing contextual research with college students—both nontraditional and traditional students.
The goals of contextual research are to:
“Build an understanding of the process, workflow, vocabulary, and cultural context.
“Gain empathy with the people you are hoping to serve.
“Identify opportunity for innovation.”
The method:
“Identify a research focus.
“Identify participants.
“Watch the participants as they work, live, and play.
“Observe real behavior. The key is observing behavior, not just having interviews. You build empathy, not just understanding.”
synthesis and sensemaking
The goals are to:
“Make sense of chaotic, qualitative research data.
“Find patterns and anomalies, and … look at the world in new ways.
“Act as a procedural stepping-stone between research and insight.”
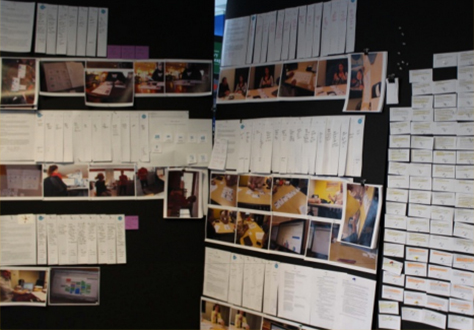
The method—The rigorousness of synthesis is important. “Marinate in the data,” as shown in Figure 67. “It takes forever. Do it yourself.”
“Transcribe all of the research data.
“Explode the data, blending utterances across participants.
“Identify groupings, and make observations about them.
“Identify anomalies.”
behavioral insights—“This is where the magic happens. Insight statements are the magic. [These are] provocative statements about human behavior, framed as universal truths. Based on a small, biased study, we moved into abductive reasoning. This leads to a value proposition.”
The goals are to:
“Formalize the big rocks that provoke new, innovative ideas.
“Make inferential leaps about why people do the things they do.
“Make obvious the specific goal for driving behavior change.”
The method:
“Ask Why? about the utterances and observational groups, and force yourself to answer—even if you don’t know for sure.
“Make an inferential leap.
“Frame the statement as a universal truth—even though it’s biased.”
Figure 67—Marinating in data
Drive Consensus
This stage involves the following:
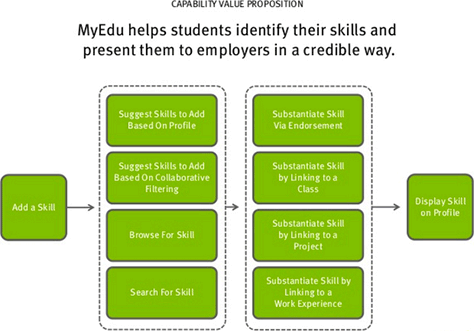
value proposition—For myEdu, the what-if opportunity “What if we helped students identify their skills and present them to employers in a credible way?”
became this value proposition: “MyEdu helps students identify their skills and present them to employers in a credible way.”
A value proposition “becomes a promise, is grounded in behavior, and makes sense.”
The goals are to:
“Formalize a new product or service trajectory based on insights.
“Identify the utility and emotional resonance you hope to provide.
“Create a North Star or vision for everyone to align around.”
The method:
“Tell—and show—a story of the existing problem state.
“Provoke What-if? questions to find ways to improve the problem state.
“Frame the new capability as a statement of value provided to a person.”
feature definition—“What are all the capabilities? We brainstormed and downselected because we didn’t have enough developers to do it all. [Identifying] the critical path is the first step toward a maximal viable product. The features all … back up to the value proposition,” as shown in Figure 68.
The goals are to:
“Define the capability in a way that supports the value proposition.
“Reduce ambiguity during development.
“Ensure we ship the right product to the right people at the right time.”
The method:
“Create scenarios and high-level flow diagrams of the ideal solution state.
“Chunk the ideal solution state into a series of smaller feature initiatives.
“Work with design to produce wireframes, comps, assets….”
Figure 68—Capability value proposition with features
Ship Product
This stage comprehends the following:
launch and usage metrics—“Launching a product is amazing. When your product is out in the world and people are using it, you can get data from it. You can get all the customer insights and data you want. You’re awash in data. You can iterate and create product extensions quickly. Make a hypothesis about what’s happening. The product manager is driving this.”
The goals are to:
“Provide everyone in the organization with a common language for tracking and understanding success.
“Understand the effectiveness of the product changes you’ve made.
“Adjust subsequent activities.”
The method:
“Prior to launch, identify usage behavior that will indicate if your value proposition is being realized.
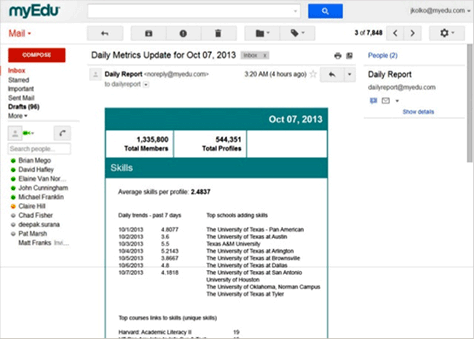
“Create a regular communication mechanism for disseminating results—for example, the MyEdu Daily Report shown in Figure 69.
“Try to understand the relationship between design and behavior.”
iteration and extensions
The goals are to:
“Improve a given capability based on usage data and insight.
“Fix defects or usability issues.
“Finish deferred work that directly supports the value proposition.”
The method:
“Make hypotheses based on usage data and value proposition.
“Prioritize design changes based on assumed effectiveness.
“Work with design to produce wireframes, comps, assets….”
Figure 69—MyEdu Daily Report
Additional Responsibilities of the Product Manager
The product manager is also responsible for the following:
communication strategy—“Communicating value: something has to happen that students get benefit out of.”
The goals are to:
“Communicate the existence and value of a new capability.
“Increase the likelihood of realizing your value proposition.
“Formalize an entryway into the new capability or feature.”
The method:
“Identify a strategic method for communicating value.
“Ensure [this] method includes an action that supports the value proposition.
“Disseminate a test to a significant population of users.”
community feedback—“It’s your job as product manager to figure out why it sucked.”
The goals are to:
“Leverage alternative signals related to product usage.
“Better understand how people perceive product changes.
“Understand the gestalt of the community.”
The method:
“Ensure that you receive all communications that in any way touch an end user.”
The Outcome
In conclusion, Jon told us, “MyEdu got acquired by Blackboard. The amplification of the story after acquisition and being able to affect positive change in the world a super feeling.” If all of this responsibility sounds great to you, how can you get started in product management? “Product management by design is a making capability,” suggested Jon. He also shared these quotations from Leland Rechis, Head of Product at Kickstarter, and Gary Chou, formerly GM at Union Square Ventures Network:
“You have to have some experience in building something. Building as a designer, building as an engineer, and probably a little bit of crossover….”—Leland Rechis
“Go make something…. If it succeeds, great, you have a business. If it fails, you have a great experience and a set of stories to talk about that make you very marketable to teams that need people like you.”—Gary Chou
Jon’s talk provided a fitting conclusion to the conference. For the many UX professionals who want to have a more strategic role in their organization, moving from UX design to product management could be an effective way of accomplishing that goal. Jon’s presentation was aesthetically pleasing and very effectively communicated his ideas. To delve more deeply into his presentation, take a look at his slide deck in Figure 70.
UX STRAT is fast becoming the go-to event for the international UX strategy community. The first UX STRAT Europe just took place, on June 4–5, 2015, in Amsterdam, The Netherlands. I’m looking forward to attending UX STRAT USA 2015, which will take place in Athens, Georgia, on September 8-10.
Here are links to the other parts in our series of UX STRAT 2014 reviews:
Founder, Publisher, and Editor in Chief of UXmatters
Silicon Valley, California, USA
With more than 20 years working in User Experience at companies such as Google, Cisco, WebEx, Apple, and many startups, Pabini now provides UX strategy and design consulting services through her Silicon Valley company, Strategic UX. Her past UX leadership roles include Head of UX for Sales & Marketing IT at Intel, Senior Director of UX and Design at Apttus, Principal UX Architect at BMC Software, VP of User Experience at scanR, and Manager of User Experience at WebEx. Pabini has led UX strategy, design, and user research for Web, mobile, and desktop applications for consumers, small businesses, and enterprises, in diverse product domains. Working collaboratively with business executives, multidisciplinary product teams, and UX teams, she has envisioned and realized holistic UX design solutions for innovative, award-winning products that delighted users, achieved success in the marketplace, and delivered business value. As a UX leader, she has facilitated conceptual modeling and ideation sessions; written user stories; prioritized product and usability requirements; established corporate design frameworks, standards, and guidelines; and integrated lean UX activities into agile development processes. Pabini is a strategic thinker, and the diversity of her experience enables her to synthesize innovative solutions for challenging strategy and design problems. She is passionate about creating great user experiences that meet users’ needs and get business results. A thought leader in the UX community, Pabini was a Founding Director of the Interaction Design Association (IxDA). Read More
Chief User Experience Strategist at Experience Outcomes
Los Altos, California, USA
A design leader for 17 years, Jim loves every minute of helping companies create competitive advantage by designing experiences that differentiate. He has worked with a range of companies—from startups to Fortune-500 companies—most recently as Senior VP of Customer Engagement at Monaker Group. He previously led User Experience at HP, Yahoo, and Cisco and has advised numerous startups. Jim chooses to work with brilliant clients, helping them unlock their unbounded potential by envisioning and designing end-to-end experiences that disrupt markets and engaging users emotionally. He often works with UX leaders to help them work through organizational challenges and ensure User Experience has the visibility it deserves and can design experiences that make the team proud. Jim also conducts design-value assessments for his clients, identifying gaps in their ability to differentiate on the experience, then helping them close those gaps and become extraordinary. Read More