In Part 1 of this series on mapping business value to User Experience, Lis introduced a new approach for proving the value of User Experience to our business and technology partners. Now, in Part 2, we’ll expand on our approach to mapping business value to User Experience and explain how we have put it to use. Our goal in sharing this information is to be as transparent as possible about our process and our intentions, so the greater UX community can pursue an important conversation that we’ve been eager to have. What is that conversation going to be about? It is a dialogue that centers around selling User Experience—which goes far beyond user-interface design—to all of our organizations. This is a dialogue in which we, as an industry, need to engage. Hopefully, hearing our story will inspire you to share your own story.
Champion Advertisement
Continue Reading…
How It All Began
First, we’d like to describe how we came to work together. Back in December of 2012, Paul was eagerly gathering together speakers to join him for a UX speakers’ series that he was holding at his company. He reached out to Lis, asking her to participate, and she immediately accepted. They then began brainstorming ideas on what Lis would speak about. One topic that quickly bubbled up to the top was an issue that Paul had been having: promoting all of the various functions of User Experience throughout his organization. Lis was quick to tell Paul about the idea she had been thinking about for mapping business value to User Experience, and they began planning out a session.
At Paul’s company, User Experience had previously been a function of Creative Services, a department using an agency model to support marketing and product efforts throughout the organization. During his time there, Paul had successfully grown the UX team from one person to three people and had moved the team from Creative Services into Product Management. This move had brought up many questions—particularly around process and their involvement in product management. It had also provided a key opportunity for the UX team to define both product and UX strategy in the organization.
But bringing UX and Product Management together was challenging, particularly because the organization still equated all UX work with usability testing and wireframes. To evolve the role of User Experience, Paul felt strongly that his team must first tie their work directly to KPIs (Key Performance Indicators), then define the KPIs in tandem with Product Managers. One of the first tactics that would enable the UX team to achieve this strategy was to clearly and directly demonstrate how all UX activities relate to business value, while making it very clear that wireframes were insufficient to fully realize the value of User Experience.
We Have a UX Team?
That’s where the Mapping Business Value to UX Workshop came into play. It provided a natural way to explain this concept to a wider audience, while utilizing the higher-valued perspective of a UX professional from outside the organization to drive the point home. We promoted the workshop heavily throughout the company. Approximately 30 people attended the workshop, from various departments, including IT and QA; and at various levels of seniority, all the way up to VP-level. What was most interesting about the attendees is that some did not even know that the company had a UX team.
This type of misunderstanding is something that Lis explored in Part 1 of this series. In essence, she had observed a lot of angst in the UX industry as we struggled to sell our talents as UX professionals in terms that our business and product partners could understand. We conceived the idea of mapping business value to User Experience as a way to develop more meaningful communication between User Experience and the business and to alleviate miscommunication and misunderstandings.
Map-making: Plotting the Graph
Since we agreed that the concept was sound, our next step in breaking down the graph for use in the workshop was to populate each axis with values along the dimensions of Business Value and UX Activities. Since the business side of the issue seemed to be more well understood by people in the company, we decided to start there. The question then became: how do we break down the Business Value axis into its different parts? Lis had an idea: What if the workshop attendees defined the components of Business Value? We could pick one goal, metric, or part of the company that created business value, then break it down along that spectrum from low to high.
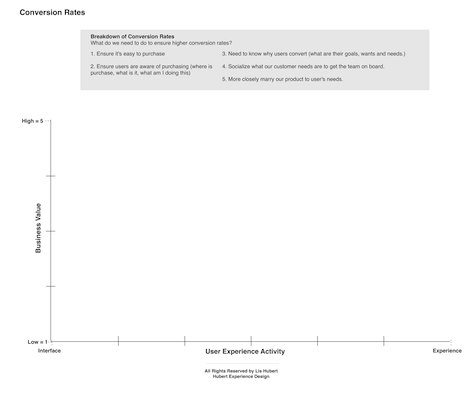
Because the workshop was to last only a couple of hours, we decided to use a general example to prove our point. We focused our example on just one business goal: increasing conversion rates—a metric any Product Manager would love. We asked, “What are the steps necessary to increase conversions?” and presented those steps to the group, as shown in Figure 1.
Figure 1—The steps necessary to increasing conversions
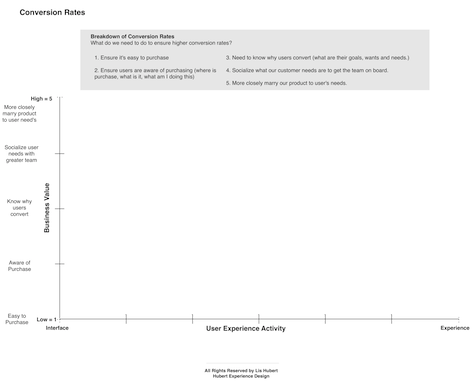
With that breakdown in mind, we could begin plotting each item on our Y axis pretty easily, as shown in Figure 2.
Figure 2—Plotting the Y axis of our graph
It wasn’t hard to realize that, if our product were more closely married to user needs, it would be more likely that it would appeal to customers—creating more business value for the company. While this may sound like our opinion, it’s actually backed by research. So if this becomes a sensitive topic within your organization, find that research and share it with your team.
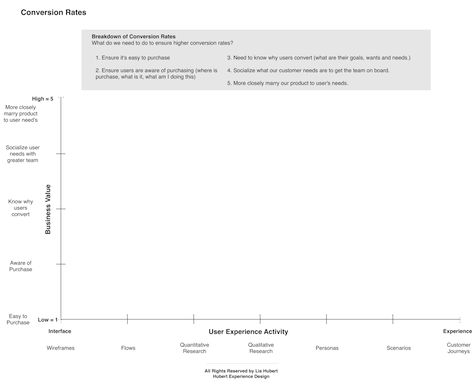
Next, we needed to plot our UX activities along the X axis. The activities at the left of the X axis focused more on tactical user-interface design, while those at the right were more strategic activities relating to user experience.
Figure 3—Plotting the X axis of our graph
While these UX activities were appropriate for Paul’s organization, keep in mind that you can customize them for your organization, depending on your definition of user experience. With our graph’s two axes defined, we were able to start plotting our data points.
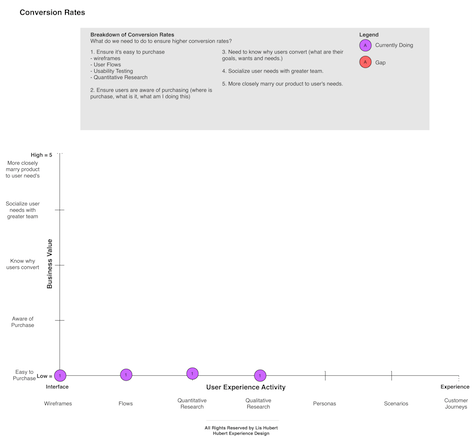
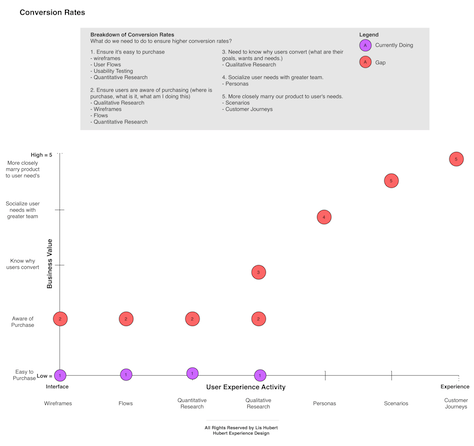
And here’s where things got interesting. We began by mapping business-value goals—for example, “Ensure it’s easy to purchase”—to the UX activities that were necessary to reach the goals, as you can see in Figure 4.
Figure 4—Mapping business-value goals to UX activities
Using the graph shown in Figure 4, we could demonstrate to workshop participants that to reach the business goal of making something easy to purchase, it would be necessary to complete certain UX activities such as wireframes, flows, qualitative analysis, and quantitative analysis. Of course, these are the bare essentials for creating something that is functional—not necessarily fulfilling or satisfying to use. We were already doing these activities within the company, so we made these circles purple.
As we mapped the rest of the UX activities to business value, as shown in Figure 5, things got even more interesting.
Figure 5—Mapping UX activities and gaps to business value
We used a different color, red, for circles that indicated there were gaps in the current implementation of UX practice within the organization. It’s also important to note that we assumed that all projects included the UX activities at the left. Since the UX activities formed a progression of sorts, including Customer Journeys would assume that we had also included all other activities on the chart, and going from left to right, every UX activity built on the prior activity.
Thus, in Figure 5, we can clearly see the following:
The more experience driven our UX activities are, the higher the business value that we can achieve.
There were way more gaps in the organization’s UX practice than UX activities that they currently covered.
This was the point that we really wanted to drive home: the company was missing out on a huge amount of business value by not engaging in more experience-based UX activities.
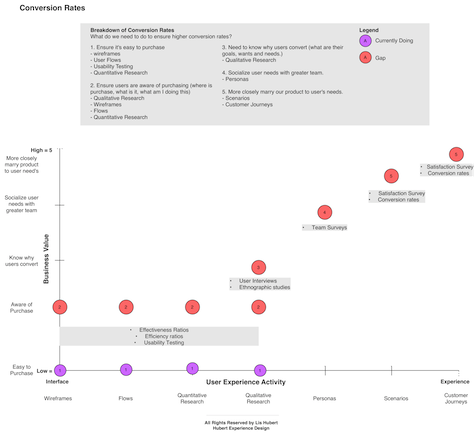
However, we didn’t stop there. To prove that our point was not just UX hyperbole, we also created a version of our chart on which we overlaid the available metrics for the UX activities that the UX team was doing, as shown in Figure 6. This let the company measure whether particular UX activities were actually bringing the business value that they promised.
Figure 6—Measuring the business value of UX activities
We tried to cover all bases, so the workshop participants would easily be able to see that not only could this work, but that this is the way UX should work if it is to increase business value.
The Aftermath
Once we had planned the workshop activity, we took a good amount of time to discuss our expectations and intended outcomes for the workshop and ensure that we could measure its success. We quickly agreed that conducting a short survey immediately after the workshop would give us solid feedback. We’ll talk about that in more detail in Part 3 of this series.
Our largest assumption going into the workshop was that it would be a catalyst for people to better understand all of the activities that the UX team performed and how each facet of our UX work was valuable in a meaningful, measurable way. Beyond that assumption, we expected that the workshop would aid the UX team in improving its process, strategy, and staffing—key issues that the UX and Product teams faced in this organization.
Throughout the course of the workshop, we witnessed a large number of interesting topics coming to the surface, highlighting just how the organization viewed the UX and Product teams. In the third and final part of our series, we’ll share those discussions with you and reflect on the overall success of our endeavor.
You can download full-size images for all of the charts shown in this article in a PDF.
Thanks for the article. I’m looking for resources on mapping UX to business value, but more in terms of recent empirical evidence showing the business value of various UX activities—personas, for example.
The exercise discussed here generates a graph where UX is mapped to business value, but 1) the mapping is not empirical and 2) the graph itself could be misleading to the extent that it encourages people to think it was based on research, when it was really more of a brainstorming exercise. Is there a way to reframe this and base it on quantitative ROI research? Look forward to hearing your thoughts.
Sorry for the late response here. Glad that you enjoyed the piece! Would love to hear more about what type of rationale you are looking for and where your confusion is. If you happen to check back, feel free to contact me with that.
Hi Charles, and thanks for your thoughts! I’m sure there is a way to do that. Unfortunately, I don’t have the quantitative research to conduct that, but if you find some, I’d love to give it a shot.
We did try to explain that this was not based on research in Part I of the series. Sorry that didn’t come through here. If you have other thoughts, we’d love to hear them!
Lis, Really excellent thinking about a subject that needs much more exploration and promotion in UX circles! Thanks for taking the time to post it! Dying to find out how this evolves for you. Write a book!! I suspect it would have a market.
Charles, I’m wondering if this would work better for you if you created the grid after initial research were concluded. In other words, conduct your research in 2 phases:
Phase 1—Initial qualitative interviews with stakeholders, management, and select users. The results could be quantified with the proper methodology. Then establish x/y axis values based on your preliminary findings. This would, in essence, create a roadmap to improving site ROI. The values along each axis would thus be established based on the initial research and have more than just speculative value.
Phase 2—More in-depth research using the initial findings as your research map. You could then establish the statistical significance of each finding with confidence intervals.
My only other thought would be to root the Business Value on the Y axis to the Business Model—that is, Value Proposition—of the enterprise. Again, in other words, establish what the components of the enterprise value proposition are. Then, once established, tie the Y axis values, in ascending order, to those. That might help to concretize the Phase 2 research and put the subsequent findings in terms that are more easily internalized by management.
The best results appear at the junction of quantitative—collaborative analysis—and qualitative user research—ethnographic interviews. This information must be analyzed together with analytical reports on the market, patents, emerging new technologies, possible financial difficulties, and so on. The article Business Value of Design talks about continuous iteration, which will influence the value.
As an independent consultant based in New York City, Lis helps to bring understanding to businesses of all sizes, ensuring that their products and services meet both business and user needs and making them both successful and enjoyable to use. Her consulting business has served clients such as ESPN Mobile, espnW, and ViacomMedia Networks, improving their brand and product experiences. Lis is a frequent contributor to the UX community’s knowledge and serves on the advisory board for Future Insights. In addition to the work that Lis does behind the scenes, you’ll also find her speaking and writing about her experiences in the field, in cities ranging from New York to Prague. Read More
Paul is a UX strategist and designer whose career reaches back to 2000, building on nearly 20 years of design, blogging, photography, and writing. At Centralis, Paul works with clients to create user experiences around business and product goals, within the context of research and design. Prior to joining Centralis, Paul was responsible for the end-to-end user experience at Gogo, the in-flight Internet and streaming entertainment company. Earlier, during his tenure at ThoughtWorks, Paul led internal experience design workshops and provided key design work to Fortune 500 and Fortune 1000 companies. His portfolio of projects includes Orbitz Worldwide, Stanford Hospital and Clinics, NorthShore University HealthSystem, iCrossing, and Daxko. Read More