The Story
As the UX team at MailChimp grew, Aarron was keen to do UX research, talk to customers more often, and do usability testing rather than just guessing—or shooting from the hip—when designing screens. They were able to build and test some prototypes and did interviews to learn from customers how their business works and how they do things, enabling them to make things that are more relevant to customers and improve the product. Aarron’s tactical approach was to do UX research and usability testing the MacGyver way—just bubble gum and duct tape—the cheap, easy, quick way to get smarter and build a better product.
Aarron started collecting customer feedback, using a form on the MailChimp Web site. It wasn’t always actionable feedback, but it helped his team to understand where their customers were coming from. Eventually, they set up some analytics packages to determine the common pathways and where people were struggling. They did competitive analysis. All of this was helpful, and they learned a lot. But sometimes they’d learn something, then lose it—forgetting what research they’d done in the past and even replicating research—because it was so much information to keep track of. “Data can languish in obscurity if you don’t use it,” warned Aarron.
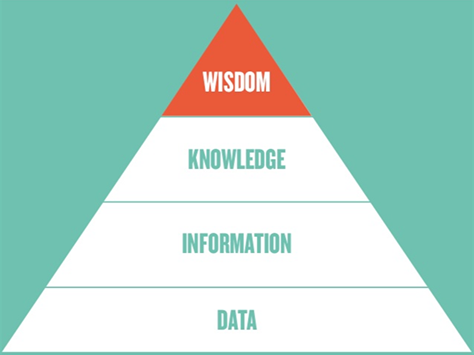
Aarron had gone from having no data to having a lot of data and was suffering from data overload. It’s hard to digest so much data and find meaning in it. As shown in Figure 2, when you look at data really closely, you can turn it into information—see what is happening, what patterns are emerging. Then you can turn that information into knowledge—see problems and propose how to fix them and make a better product. “But only rarely does knowledge turn into real wisdom that could guide the future,” asserted Aarron. Few figure out how to connect all of that information, maintain it, and start to see the relationships between seemingly unconnected things. Rarely do they get to that point where they have wisdom, see the problem, know what to do about it, know why something is happening, and see what’s going to happen in the future.
“Having that wisdom to find out what’s coming next; it’s called strategy,” said Aarron. Going from being very tactical, studying things very closely, making some adjustments, but never looking up, never seeing the landscape of how this all fits together. And that’s what strategy is about. So much of user experience research—that learning—is about tactics. But doing only that, you can never make user interfaces all that much better and smarter. You can never make giant leaps.
Strategy is a core thing. It’s such an important thing for a company to be smarter, leap in front of its competitors, and create new things that help its customers solve problems better. When you can begin to develop strategy, this helps lots of different teams to move in the same direction.
As UX professionals, we’re great at research. We’ve got research down to a science. We study customers very well. We have all of these techniques. We have the tactics, and we’re damn good at it. But research is in silos. Rarely do we connect all of this stuff together. We leave data and information—valuable stuff—on the table. Perhaps another team controls that stuff, and they don’t let other teams come look at it and compare notes. So, we need connections. When a company starts to scale, get to a certain size, we need connections between this information, and ultimately, we need connections between the people that are the stewards of that information.
About a year ago, Aarron found himself in a crisis: his email inbox was inundated with customer feedback from a Wufoo form on their Web site. It was hard to manage and know what to do with it. Although it was good information that helped him to understand what they could do better, he couldn’t really adjust his roadmap for all of these things. He needed to see whether there was critical mass on specific issues that would warrant shifting their resources. He needed to do something with all of that information. Aarron thought, if he could just put all of it in a bucket somewhere, maybe later he could find something to do with it. He needed a database of some sort. They had experimented with wikis in the past, to collect information, but using them was very cumbersome and difficult.
So, he decided to funnel this stuff into Evernote—a dumping ground that is essentially a database—and clear his inbox on a regular basis. Evernote was cheap—he just set up a free account. And he could just email the stuff in. He set up a Gmail script, so any time an email with a particular subject line comes in and it’s starred—that is, he’d read through it and starred it, meaning it’s worthy of attention later, that this is the cream—the script sends it to an email address that drops it into Evernote and puts it into a specific notebook. So, he collected this information, thinking that he might be able to do something with it later.
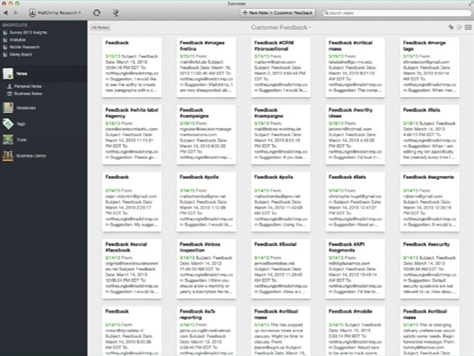
At that point, he had a few hundred pieces of information, as shown in Figure 3. The feedback form asked for an email address, and he curated that information, so if he ever needed to get in touch with a person who gave feedback, he had an easy way to do that.
Later, when MailChimp was working on email-automation features, the CEO, Ben Chestnut, asked Aarron whether he had any research data on an RSS-to-email feature. So Aarron did a quick search of the database for RSS. That search turned up about 45 pieces of feedback—and it was really good, relevant, insightful feedback with email addresses attached. He started to see some patterns emerge and emailed a few of the people to get clarification or more background information. In just few days, he was able to provide a solid assessment of what people were struggling with.
This made Aarron think about what other types of information they could put into Evernote and cross-reference and connect. He started talking to other people—UX design researchers who did a lot of interviews and usability testing, had transcripts of interviews, and collected customer feedback—and asked them to create a new notebook and start funneling that stuff into Evernote as well. With more different types of information, their database got a little bit richer. They were able to turn qualitative information into quantitative information—for example, how many people had requested a particular feature in a given time period. If the numbers were small, the data helped them to decide what features they would not invest in.
By this time, the UX team had all of their data in Evernote. But Aarron wondered what they could do if they added more data, so he started talking to other teams that had a lot of information and asked them to funnel that information into Evernote as well. For example, he talked to a data scientist who had aggregate findings that he could share; someone responsible for delivery statistics who had data on customer behaviors in aggregate; a data analyst in Support who reviews all support requests and transcripts and reports on trends and patterns in the data; an engineer who does analytics and finds patterns in databases; a person who monitors comments on their blog, as well as posts on social networks. All of this was valuable information that helped them to get smarter.
Another engineer offered to set up some scripts that would capture common pathways and activities for users in different industries. He set up cron jobs to query the databases and, via emails, dump the results into another notebook in Evernote, so they could see the aggregate behavior. They set up cron jobs in Google Analytics, too. The team began to get a broad understanding of what all customers were doing, as well as what individual customers were doing. They were able to start quantifying the number of users having particular issues with the product and identifying patterns in the data coming from all teams.
So, in addition to customer feedback and transcripts from UX research interviews, this dumping ground in Evernote had grown to include notebooks for Web analytics, data from account-closing surveys in Wufoo, blog comments, competitor news from Google Alerts emails, delivery statistics, industry research—articles that they captured using the Evernote clipper in their browser—release notes, support data, survey data, and social-channel feedback from tweets and Facebook posts. All of these different, disconnected, totally heterogeneous data sets—to which Aarron’s UX research team had not previously had access—now got dumped into Evernote. All of it was searchable and taggable, so they were able to find things across silos. Aarron’s team was able to make data available without having to launch a new study.
This was a big win—not only in what they could learn, how fast they could learn it, and how they could go from tactical to strategic thinking, but in its political and collaborative implications. People became more aware of what their colleagues were doing. There was a spirit of sharing. It was a big win in the way it shaped their team’s behavior. They started doing a data nerd lunch each week to share ideas. There was a fluid exchange of ideas. In connecting the data, they also connected the people.
How Does Connected UX Work?
The great thing about this approach is that there isn’t a big learning curve for how to contribute and consume information. Here are “the nuts and bolts, the mechanics” of connected UX:
- using email as the API—The way to contribute is via email. If something would be valuable to share, you can write something, copy and paste something, set up a stream to stream in new data, and just send it to this email address that you share internally at your company. There’s no additional workflow that you have to learn. You already know how to send an email. Generate and email a report, and it automatically comes into Evernote. Screenshots go in very easily. Easy in, easy out. At MailChimp, a lot of people in different roles started contributing because it’s so simple to do.
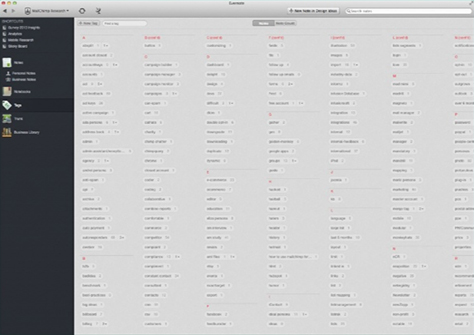
- routing data—You can funnel things into Evernote simply by adding @notebook—@ and the name of a notebook—to the subject line of an email message, and it will go into that notebook. Evernote has an email parser. It sees that incoming email and parses it for you. All of this data is very unstructured, and that’s a beautiful thing because it makes it easy to contribute. But it’s potentially problematic because synonyms can skew your searches. You can deal with that by tagging things, so they’re easy to find. In the subject line of an email message, just add a hashtag and a particular subject or piece of metadata—#tag. This gives you a lovely way to browse different topics and see whether there are patterns there—to find patterns that you might not be looking for. MailChimp tags stuff really well, but not everything needs a tag. Customer feedback needs tagging. There are now many, many tags and, every once in a while, they have to take a look at the tags, group things, and delete some tags. If you drag tags onto each other, they bucket. Figure 4 shows the tags for MailChimp Research in Evernote.
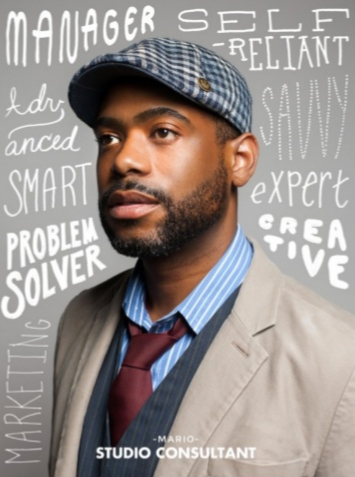
- tagging with personas—The more customers you talk with, the more you start to see patterns, or customer archetypes, for which you can create personas. Once you’ve got all of your information in Evernote notebooks, you can tag it with specific personas. In the subject line of an email message, just add a hashtag and a persona name—#persona. This gives you an additional dimension by which to do searches and understand different customer archetypes’ traits, motivations, and behaviors. The UX team at MailChimp talked to dozens of customers and created a series of personas to help them understand their customer archetypes—such as Andre - Developer, Fred - Ideal User, Eliza - PR Manager, Ada - Receptionist, and Mario - Studio Consultant. They turned that information into a series of persona posters like that shown in Figure 5. They tagged everything in their database with these personas.
- searching—Aarron showed the power of searching for tags like Android or autoresponders. The process is simple: You just do a quick keyword search for something and get all kinds of useful information that helps you to progress from data to information to knowledge about a topic—and, ultimately, to wisdom. Once you do a search, organize, categorize, and tag that information—perhaps putting it into a spreadsheet. Collect email addresses. Do follow-up interviews with people to collect additional information. Work collaboratively to make it faster to go through studies. Divide and conquer. Then funnel the information back into the database, so other people can discover it.
- providing open access—Anyone on a team can open an Evernote account, explore the data, and contribute or just lurk until they eventually find a way to contribute. What if you want to discover something you might not be looking for and don’t know what questions to ask? When you have access to information on lots of different devices, you can open up Evernote anywhere and do a quick search or get notifications about what your colleagues have been contributing—the new things that have been coming in. You start to learn things that you weren’t looking to learn. You start to discover what’s interesting, what’s relevant. Having your data available on all of your devices—not only making it open to all of the people on your team, but having it easily accessible to them—makes it easier for everyone to get smarter.
- fostering joint ownership—Although this started as the UX team’s project, once MailChimp openly shared data across teams, it very quickly shifted to joint ownership. Everyone was responsible for the quality of the information in the database. The real power of connecting all of these things together—connecting people—is that people are now empowered to answer their own questions and become smarter designers. “We want people to be empowered. We want people to be smart about what they’re doing,” exclaimed Aarron.
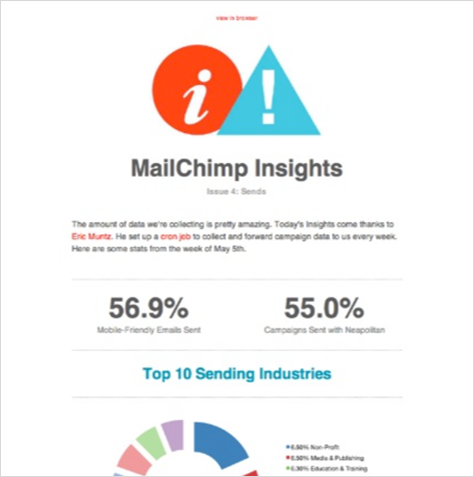
- telling stories—Data does not transform itself into wisdom. You have to do that yourself. Wisdom comes from telling stories. At MailChimp, they turned their information into stories that they could share with the team. Few people would find a 40-page report of research findings engaging, so they turned them into short video clips that they could IM to people. Videos that showed the future of the MailChimp product, but not the user interface. Instead, they showed people trying to solve problems in their workday. When stories have a URL, they’re IMable, and it’s easy to share them with someone on your team. This makes it easier to keep everyone moving in the same direction. It’s one thing to get the wisdom and create the strategy, but then you’ve got to communicate it to a lot of different people and get them moving in the same direction—and that’s no easy task. So, every two weeks, they send out the MailChimp Insights email newsletter, shown in Figure 6, to the whole company.
Principles of Connected UX
Aarron shared some principles of connected UX:
- “It’s not about the tools.”—“If you make things more usable, people will participate,” declared Aarron. MailChimp had tried a lot of things that didn’t work. “Wikis just frustrate and confuse people. They don’t work on your phone.” A member of the audience commented that Jira is not optimal because there’s a ton of overhead.
- “It needs to be easy in, easy out.”—If there are any barriers to discovering things, any barriers to contributing, people won’t contribute, they won’t take part. It’s got to be easy to access—on mobile, too.
- “It’s data for everyone and everyone’s data.”—This is the core principle that makes connected UX work. Anyone can contribute to the database. There are no defined formats. It’s open and accessible, so everyone can participate, explore, and trust that this is where they can get answers to their questions—in many cases, questions that they hadn’t been asking before. You can unsubscribe from a notebook that isn’t relevant to your needs.
Strategy
“We’ve started to build collective wisdom and, from that, to create strategies based on patterns,” shared Aarron. When teams start collaborating—teams who each have data—this helps to break down the walls between silos. “The magic is people talking to people.”
We need to break down the silos of people, the silos of data that divide the teams that control the data and what’s going to happen with it. Break down the walls between the teams. Break down the walls between the data and start connecting the different pieces to find patterns and to find meaning.
We’ve got so much information that we’re leaving on the table. All kinds of information that could be valuable. What could you mine from your databases? How could you tie all of this information together and find a pattern that you couldn’t see before?
“We’re good at research. Now we have to do just as well on storytelling,” exhorted Aarron. “Listen hard, change fast.” We have to be able to stop guessing. All of the information that we need is right in front of us. We just need to draw the connections between disparate pieces of data. “Big data is going deep into a silo. We’re going horizontal.” The problem with big data is that it’s very rarely practical. Can you act and change your world with that?
Strategy is both looking at the big, guiding star of an overarching strategy and little microstrategies along the way. We have to try a lot of things. While it’s good to see all of the connections between things, it can seem overwhelming.
Smart Design
Smart design is problem solving, not decoration. “We want to able to design and stop decorating,” exclaimed Aarron. So much of design often goes in that direction, where you’re just adding visual treatments to something that someone hands you. But when you know exactly what’s going to help someone, you can make smarter decisions. So, designers go from being decorators to being problem solvers. They’re doing something that’s more meaningful.
Connecting data is a really important thing—to make designers smarter, to make companies smarter, to make them work better, to connect teams together. When you connect data, you connect people. When you connect people, they can collaborate. They can make better things in a better way. And that’s what we’re all excited about. That’s what we’re motivated by.
The coolest thing about this idea of connected UX—a connected company: When people can ask crazy questions and know that they can get answers, they ask more crazy questions, and they get more answers. They solve problems faster, and they make smarter designs. And they can serve customers better.
You can filter and quantify information. Qualitative information can, to some degree, be quantified. When you can quantify things, you can start to make decisions about what is and isn’t worth your time. And that is how you turn data into wisdom—you go up that hierarchy, that pyramid. Connect information. Connect people. This creates a culture of inquiry, where lots of questions get asked—a culture of learning. This is so invaluable—not just for User Experience teams, but for all teams and all companies that are trying to serve a big audience.
Aarron is a very effective storyteller and speaker and presented a beautiful slide deck comprising headlines and pictorial slides, which you can check out in Figure 7. After hearing Aarron speak, I was excited about trying this approach in my own organization.
UX STRAT 2013: Aarron Walter, “Connected UX” on SlideShare
Using Big Data and Personalization to Drive UX Strategy: A Case Study
Reviewer: Margie Coles
Presenter: Rob Houser
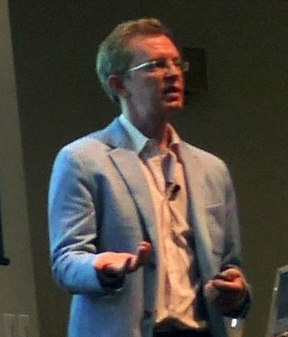
Rob Houser, Senior Director of Product Management at Sage, shown in Figure 8, delivered a case study to describe how his company leveraged big data to deliver a more personalized user and customer experience. He described how a UX project whose goal was to help new users get started had evolved into a corporate-wide customer experience (CX) project. According to Rob, reframing the project as creating a service or product that would generate revenue—rather than another cost center—was key in gaining enthusiastic buy-in from C-level executives at Sage. He recommended that UX professionals “find a way to tie UX strategy to business strategy,” so leaders will support user experience.
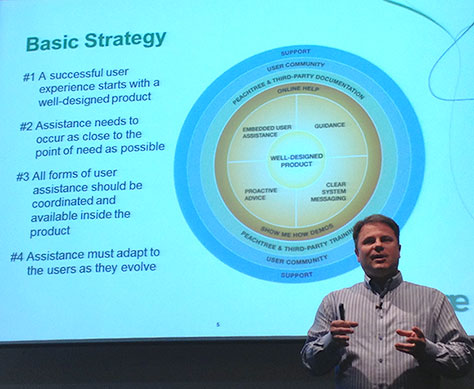
Initially, the UX strategy was to improve the support experience—especially during the setup process—and, thus, minimize user frustration and product abandonment. The basic UX strategy assumed a well-designed product at the core and ample embedded user assistance that would be readily available within the product, as shown in Figure 9.
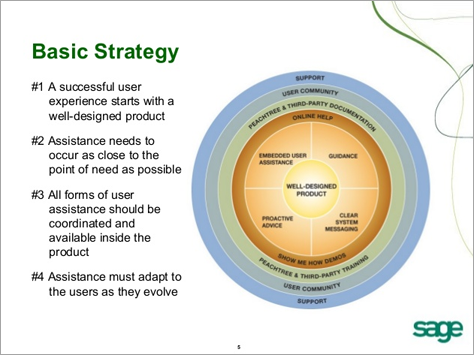
Throughout the company, the UX team evangelized a six-tiered safety net of user assistance that was based on a model from Microsoft. As illustrated in Figure 9, the levels of this model included the following:
- Level 1—Well-designed product
- Level 2—On-screen assistance
- Level 3—In-product Help and demos
- Level 4—Standalone documentation and training
- Level 5—User community
- Level 6—Support center—and Sage Advisors
The team built a proprietary system for tracking usage data on the desktop to learn more about users and what features they were using—especially for users who had significant needs for support. This helped the team to focus usability improvements on high-impact areas of the product. They also developed a rules engine that supported in-product delivery of Advisor Messages—personalized, proactive, push messages that the product delivered according to product settings, user behavior, and known product issues.
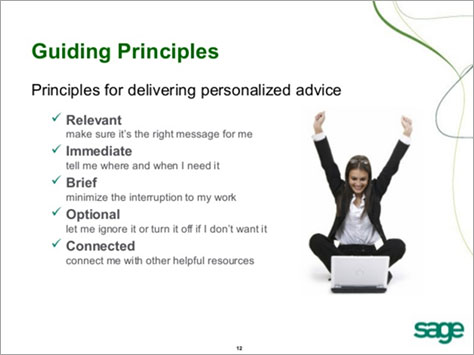
Most importantly, the UX team proposed the introduction of Sage Advisor services that would deliver personalized advice and guidance to customers—advice that would be relevant, immediate, brief, optional, and connected. While the executives praised the UX team for its innovativeness, they were concerned about the costs inherent in delivering such a high level of support. The common refrain from executives: “How will we monetize this?” So, the UX team stopped talking only in terms of making improvements to user experience and reframed the Sage Advisor services as value-added advisory services that the company could sell. This reframing proved to be highly successful in gaining executive support and traction.
Sage established some guiding principles for delivering personalized advice to their users, which are outlined in Figure 10.
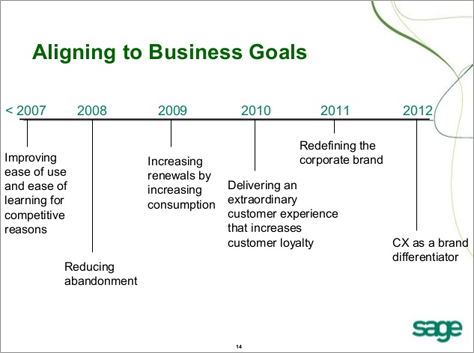
Rob emphasized the importance of aligning each of their annual UX strategies to business goals—and communicating them in such a way that they would easily appeal to the CEO/C-level mindset. Surveying UX strategy at Sage from 2007 through 2012, as shown in Figure 11, the progression of impact on the company is readily apparent. By 2012, UX strategy had expanded to include Customer Experience as an all-up brand differentiator.
- 2007—Improving ease of use and ease of learning for competitive reasons
- 2008—Reducing abandonment
- 2009—Increasing renewals by increasing consumption
- 2010—Delivering an extraordinary customer experience that increases customer loyalty
- 2011—Redefining the corporate brand
- 2012—Customer Experience as a brand differentiator
In summary, Rob told us:
- “Our UX strategy has impacted the brand and given many disparate products a more common customer experience.”
- “Impacting the customer experience drives revenue more directly—because it is more closely connected to renewals, attrition, purchasing, cross-selling, and up-selling—which the business can more readily appreciate.”
- Customer Experience is a good partner for User Experience. Look to the CX people in your company—generally in Marketing—as partners in driving UX strategy forward in your company.
It is clear that UX strategy at Sage has done more than provide greater consistency across the user experiences of many disparate products. At Sage, UX strategy has led to the adoption of Customer Experience as a primary brand differentiator for the business. UX strategy now directly drives increased revenues.
Rob concluded his talk by calling out two different aspects of UX strategy:
- making better products
- impacting customer experience across an organization—which gets you closer to the C-level table
You can see Rob’s entire presentation in Figure 12.
UX STRAT 2013: Rob Houser, “Using Big Data and Personalization to Drive UX Strategy: A Case Study” on SlideShare
Morning Vignettes
Reviewer: Pabini Gabriel-Petit
After the morning break, another series of three vignettes—fast-paced, 10-minute presentations—were delivered back to back. Talk about drinking from a firehouse! The presenters did an amazing job, packing each presentation with valuable insights.
UX Strategy Needs Numbers
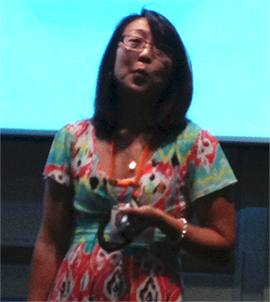
Presenter: Pamela Pavliscak
Pamela Pavliscak, shown in Figure 13, is the Founder of Change Sciences, a UX research and strategy firm in New York City. She kicked off this round of vignettes at UX STRAT, speaking about why UX professionals should start to embrace numbers as a way to quantify design decisions, set targets, draw meaningful comparisons, and identify high-performance patterns.
Where does all of the data that UX strategists work with—like that shown in Figure 14—come from and what does it really mean? Pamela told us, “Data is really about people—at least the traces that they leave.”
Why does UX strategy need numbers?
- “Numbers spark curiosity. We want to fill in the blanks. We are pattern seekers.” What’s a test of curiosity? Do numbers foster exploration? Are they not bullshit?
- “Numbers simplify.” They provide clarity. “We see complexity.” But there are similarities between people in the C-suite and users. They’re both “pressed for time, worried about the bottom line, not likely to read much”—and both “pay attention to numbers.” What’s a test of simplicity? Do numbers reduce uncertainty? How can they create positive change?
- “Numbers motivate. Numbers tell stories.” They act as catalysts. What’s a test of motivation? Do numbers prompt action? How can numbers help you to make connections?
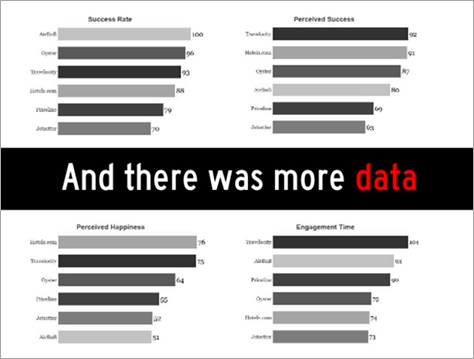
- “Numbers tell a story.” Stories like: We know our users—data are people. The right direction. Our site has improved. We are competitive. “You can’t tell these stories without numbers.” Figure 15 shows examples. How can numbers better communicate?
- “Numbers translate. Numbers are a common language.” They’re the lingua franca of the C-suite.
What are you going to do with all this data? You need a need a framework to bucket all this data into groups.
Have a look at Pamela’s slide deck—a beautiful example of a pictorial presentation—shown in Figure 63.
UX STRAT 2013: Pamela Pavliscak, “Why UX Needs Numbers” on SlideShare
The Empathy Cycle: Customer Insight Gets Rhythm
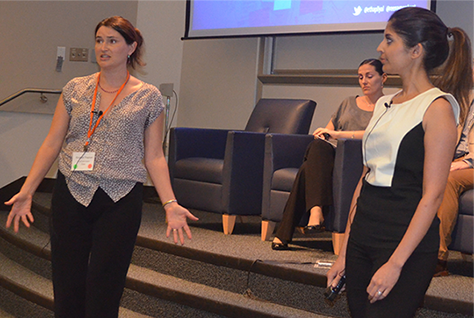
Presenter: Andrea Moed
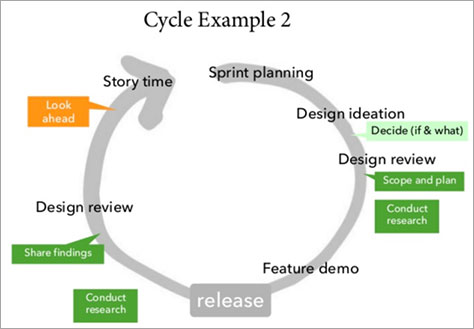
Next up was Andrea Moed, shown in Figure 17, UX Research Lead at Inflection, who spoke about how they needed UX research and customer insights to get rhythm and sync up with Inflection’s two-week Sprint cycles and presented the empathy cycle that enables her to do so. In the past, they’d done big research up front. Now, the tempo at which they release code drives the pace of UX research, and the UX research that Inflection does has a specific intent and a point of view.
Instead of following a waterfall development process in which they’d learn, design, develop, test, release, and plan; Inflection follows an iterative, agile process, in which they plan, design, build, release, and measure—repeatedly. “When product development is iterative, UX research needs to be, too!” exclaimed Andrea.
Andrea presented a case study about introducing UX research at Inflection, an Internet startup with a culture of constant, incremental improvement. Her goals for UX research were to seize the moment when insights could make the biggest difference, support decision making in every cycle, and provide input to the product roadmap across cycles. So she needed to get answers to questions about when the team agrees on requirements, explores proposed solutions, and commits to a design to ensure that UX research would be an integral part of that process, as shown in Figures 17 and 18.
The team was driven by metrics, analytics, and A/B, or split, testing; watched for key moments, then defined requirements and designed solutions for those moments.
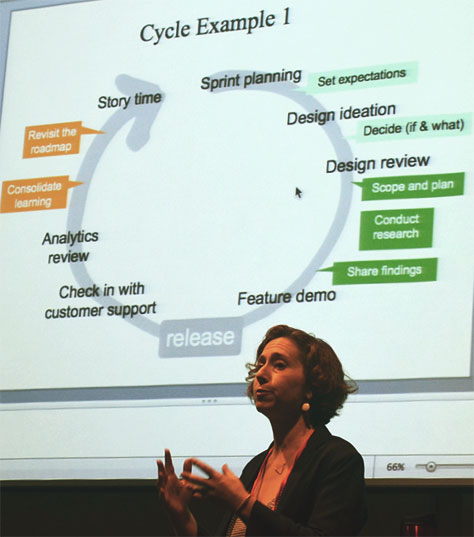
In empathy cycle 1, Andrea set expectations around UX research during Sprint planning. In both empathy cycles 1 and 2, following design ideation, she decided whether to do UX research during a Sprint and, if so, what research to do; and during design review, she scoped and planned, then conducted UX research. In empathy cycle 1, she shared findings right after conducting the research. In empathy cycle 2, Andrea conducted further research after the product’s release, then shared findings from both rounds of research. In empathy cycle 1, after analytics review, but before story-writing for the next release, she consolidated learnings, then revisited the roadmap; while in empathy cycle 2, that was a time for looking ahead.
Andrea concluded that “doing focused research within Sprints makes room for broader questions across Sprints,” when they could do strategic research relating to new products and new opportunities. “What does each team member know about our customers? What do they wish they knew?” During each Sprint, they observe and interpret customer behaviors. Across Sprints, they learn motivations and expectations. “UX research in an agile organization doesn’t just have to be fast. It can be strategic, too,” stated Andrea.
“In an iterative world,” said Andrea, “UX research
- fills the gaps in customer understanding
- builds a shared, yet changeable vision of customers
- enables us to strategize from empathy
- customers feel anticipated and recognized”
Figure 19 shows Andrea’s entire presentation.
UX STRAT 2013: Andrea Moed, “The Empathy Cycle: Customer Insight Gets Rhythm” on SlideShare
Determining What Good Means, with Performance Continuums
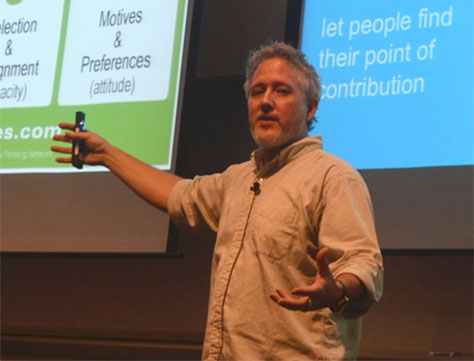
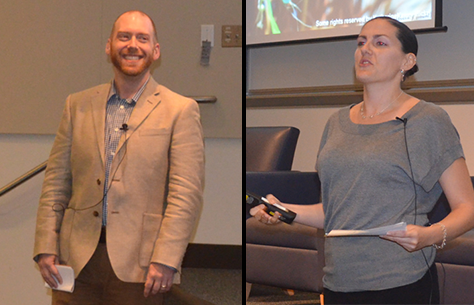
Presenter: Dan Klyn
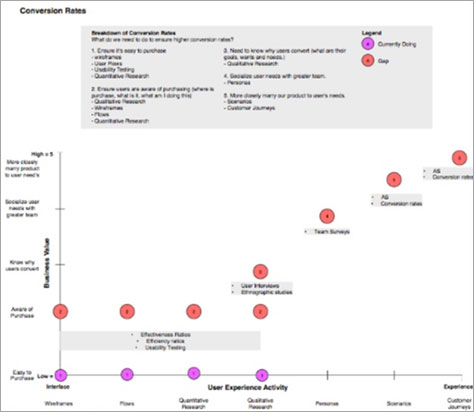
The final presenter in this series of vignettes was Dan Klyn, shown in Figure 20, who is an Information Architect and Cofounder of The Understanding Group (TUG), an information architecture consulting practice in Grand Rapids, Michigan. Dan told us, “Stakeholders all have different ideas about what good means, different intentions and motivations”—for example, whether to add features and/or optimize user experience; acquire and/or service; optimize and/or innovate; focus on the present and/or the future or on engagement and/or conversion. We often frame these things in terms of zero-sum games—this versus that—rather than moving from versus to yet.
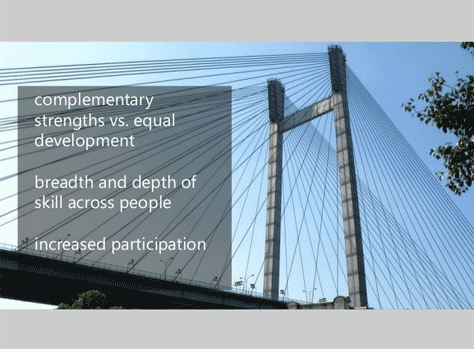
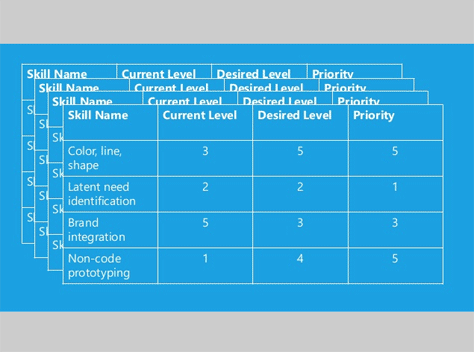
“If we want to know what good means, we have to stack these things up,” asserted Dan. We have to reconcile each of these continuums against each other. Where are we now, and where would we like to go?
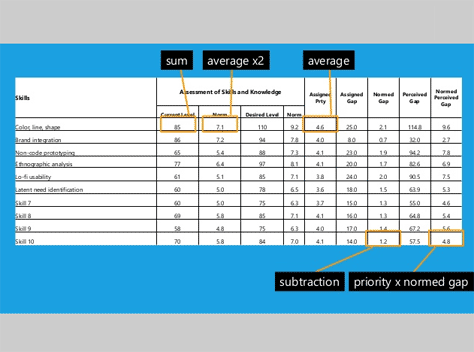
Dan shared these “tips for using performance continuums:
- Don’t settle for or.
- Do embrace yet.
- Do use grammatical symmetry.
- Don’t use true opposites.
- Do sort continuums into similarly granular clusters.
- Don’t start sorting and narrowing too soon.”
Check out Dan’s presentation in Figure 21.
UX STRAT 2013: Dan Klyn, “Determining What Good Means” on SlideShare
The 10 Commandments of UX Strategy
Reviewer: Pabini Gabriel-Petit
Presenter: Ronnie Battista
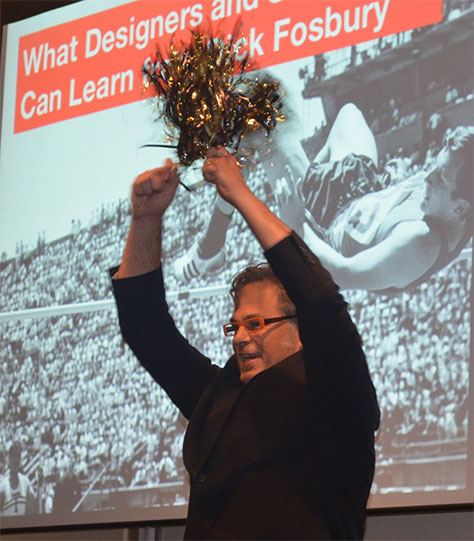
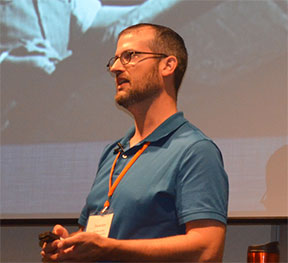
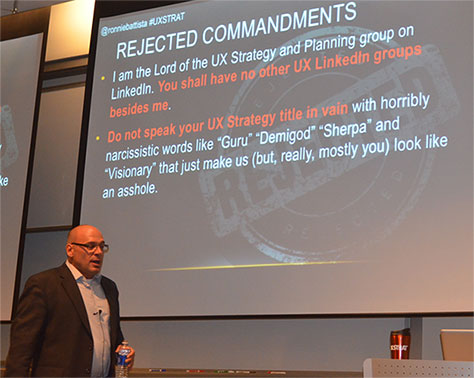
The morning closed with the most entertaining presentation of the conference, when Ronnie Battista, shown in Figure 22, delivered his rousing 10 Commandments of UX Strategy. Ronnie is UX Practice Lead at Slalom Consulting, in New York City.
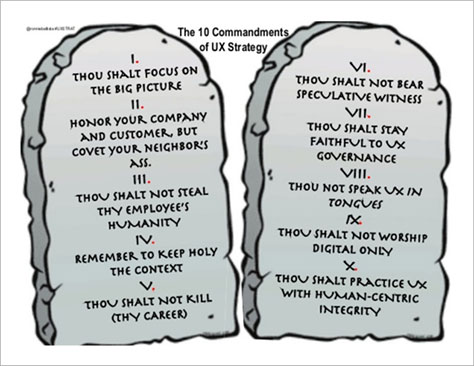
Here and in Figure 23 are Ronnie’s 10 Commandments of UX Strategy:
I. THOU SHALT FOCUS ON THE BIG PICTURE.
- “Strategic UX initiatives and projects will always be here; those with the greatest chance of long-term business value stay framed in the big picture.”
- “Seek the strategy behind even the most tactical engagement. No matter how tactical, you should always seek to root your engagement in the big picture.”
We need to think about the larger context of what a business is doing—its longer-term strategy.
II. HONOR YOUR COMPANY AND CUSTOMER, BUT COVET YOUR NEIGHBOR’S ASS.
- “What are the specific business levers that enable your company to win out over competitors, and how can UX directly impact them?”
- “Understand the company.”
- “Understand the competition.”—What are competitors doing?
- “Understand the customer.”
III. THOU SHALT NOT STEAL THY EMPLOYEE’S HUMANITY.
“When humans are on both sides of an interaction, attention must be [paid] to their mutual success.”
IV. REMEMBER TO KEEP HOLY THE CONTEXT.
- “The UX Strategist must strongly advocate the need for context in any attempt to create or redefine an experience.”
- “Unfortunately, our global supply of true ‘genius design’ potential … is inversely proportional to well-intended senior executive gut feelings that are unencumbered by facts.”
- Context is really important.
V. THOU SHALT NOT KILL THY CAREER.
- “It is becoming increasingly clear that business—and the UX profession—is fast moving. Prepare for life-long learning.”
- “A UX Strategist must keep the door open to understanding current UX software, processes, and services.”
- We have to constantly change. We have to constantly reinvent ourselves.
VI. THOU SHALT NOT BEAR SPECULATIVE WITNESS.
- “UX strategy embraces both qualitative [and quantitative] user research, or set / targeted metrics.”
- “For the Quals: No one here will argue against user research. But we need our clients to understand our need to connect with real human beings, even if we think—or they think—we know the answer.”
- “For the Quants: Big Data needs UX strategy. We ask why something happened, interpret the data into valuable insights, and turn Big Data into Big Impact solutions.”
Most successful studies provide a combination of both qualitative and quantitative data. Data for data’s sake doesn’t mean much.
VII. THOU SHALT STAY FAITHFUL TO UX GOVERNANCE.
- “Experience is fluid with periods of evolution and revolution.”
- “An ongoing UX governance program to measure and optimize the experience is vital to long-term viability.”
- “A UX Strategist should strongly advocate Experience Management infusion into the company’s program/ portfolio management infrastructure.”
- “A journey map can only take you so far.”—Sometimes leaders aren’t able to operationalize journey maps and nothing happens. Where does the money go in an organization’s portfolio and project management? Find a really good way to connect to a program management plan. Use a journey map as a driver for key management objectives.
VIII. THOU SHALT NOT SPEAK UX IN TONGUES.
- “A UX Strategist at heart understands that UX and the practice of UX is ultimately one of communication.”
- “As an empathetic translator / proxy advocate for the human audience.”
- “In the products and services we design, which communicate utility and inherent value.”
- “And in the ability to convey to business leaders the experience implications of why a path should or should not be chosen and the value of ongoing investment and growth in UX.”
- UX professionals are storytellers.
- We must speak the language of business.
IX. THOU SHALT NOT WORSHIP DIGITAL ONLY.
Service design falls under our umbrella.
X. THOU SHALT PRACTICE UX WITH HUMAN-CENTRIC INTEGRITY.
- “As translators of business and technology to the human condition, UX is at the vanguard of a technological revolution that has already irrevocably changed base human interaction over the last two decades”
- “Possessing the tools and skills to capitalize on human behavior in context is powerful.”
- We have the power to influence outcomes.
- Do no harm.
- We own the responsibility for telling our clients that there is more than profit.
In contemplating UX strategy, Ronnie asked: “How can I be the best in an emerging field that’s still defining itself? How can we help build this profession to grow and support those that come after us?”
Ronnie’s talk truly delighted the UX STRAT audience, who smiled and laughed throughout. Of all the great talks at UX STRAT, this one was my favorite. You can read more about Ronnie’s 10 Commandments and why he chose to speak about this topic at UX STRAT in his own words, in his UXmatters article “10 Commandments of UX Strategy.” If you haven’t already read it, be sure to read Ronnie’s article! Check out Ronnie’s slides, shown in Figure 24. Most are pithy. Many are hilarious!
UX STRAT 2013: Ronnie Battista, “10 Commandments of UX Strategy” on SlideShare