One of the most common questions I get in my workshops on mapping is, “How do I begin?” Aspiring mapmakers may see the immediate value in these techniques, yet they have barriers getting started.
Getting stakeholder buy-in is a common challenge. I’ve been fortunate to have had opportunities to create diagrams of all kinds and have found that stakeholders see the value in mapping only after the process is complete. As a result, initiating an effort requires convincing them up front.
Champion Advertisement
Continue Reading…
What’s more, a mismatch of expectations early on can lead to problems later on. It’s therefore crucial to frame your intent clearly from the outset, particularly when multiple stakeholders are involved. With the range of possibilities, it’s up to you to define your mapping effort appropriately. Some key points to remember are:
Include others in the process. The mapmaker has different roles throughout the effort: researcher, interpreter, and facilitator. It’s critical to get participation from others at all points in the process. Remember: the objective is not just to create a diagram, but to engage others in conversations and develop solutions together as a team.
Consider both current and future states. This book focuses on creating what can be described as
current state diagrams: visualizations of existing experiences. Envisioned future products, services, and solutions are generally seen as an added layer to these diagrams. I believe it is important to see both at once: cause and cure are visible simultaneously. Complementary techniques, however, help flesh out envisioned future experiences, some of which are discussed in Chapter 8.
Realize you can’t control everything. Strive for coherency across the entire experience, but also understand that you won’t be able to design every touchpoint. There may be interactions you can’t or choose not to control. Still, an awareness of the interdependencies across actors and touchpoints informs your strategic decisions.
Start a mapping project as you would any other effort: determine your goals, scope, costs, and time frame, and make them explicit. This need not be lengthy or time consuming—it may only take a single meeting. But getting off on the right foot increases your chances of success.
This chapter details some of the pitfalls and lessons I’ve learned when initiating a mapping project. By the end of this chapter, you’ll know what key questions to ask up front and how to get a mapping effort off the ground.
Start a New Project
With increasing frequency, managers and clients are directly requesting artifacts such as customer journey maps or experience maps by name. This makes getting started easier.
Without an educated audience, however, starting a mapping effort can prove difficult. Stakeholders may not be immediately aware of the benefits of mapping. It provides a type of insight that organizations need to know, but they don’t realize they need to know it until they go through the process.
Before embarking on a project, first determine the level of formality, then convince the decision makers to get started.
Determine the Level of Formality
Every team can benefit from mapping in some form—from sketching by hand or working with detailed diagrams. The scope of the effort can vary greatly. Determine the level of formality that’s most appropriate before beginning.
This book describes a formal approach to mapping. In some cases, such as an external consultant working with a large organization, a rigorous approach makes sense. In other situations, a full-blown process may be inappropriate. For instance, when you’re working in a startup, an informal approach is fine
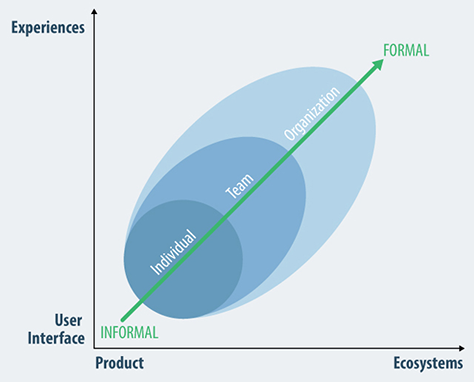
The formality of a mapping effort can be seen along three dimensions, shown in Figure 4-1. The horizontal axis ranges from producing a single product to providing service ecosystems. The vertical axis indicates movement from the design of a discrete interface to the design of holistic experiences.
The third dimension, in the middle of the graph, shows an increase in the group size.
Figure 4-1—The need for models increases when entire organizations design experiences for ecosystems.
* This diagram is adapted from a talk by Hugh Dubberly: “A System Perspective on Design Practice,” video talk at Carnegie Mellon (2012).
Efforts tend to become more formal as you move up and to the right in this chart. For instance, a designer working alone on a single product may not need a formal diagram. But a large team dealing with an entire service ecosystem likely would. Consider where your organization falls on this chart.
Finally, the nature of the engagement also affects the level of formality. External consultants will be motivated to assume a more official approach. Teammates in a small startup, on the other hand, may map experiences more casually.
The point is to consider the appropriate level of formality before beginning. This will determine how much effort you put into each of the phases outlined in this book. Only do as much work as needed.
Convince Decision Makers
Once you determine the level of formality, convince decision makers to back your effort. Internal employees typically encounter different hurdles than external consultants. The former need to persuade; the latter need to sell.
Though your relationship to stakeholders may vary, many of the arguments are the same. To convince decision makers, know the objections, provide evidence, find a champion, and run a pilot to demonstrate the value. Also, create a pitch that you can recite at will.
Know the Objections
If you get pushback, be ready with persuasive arguments. Table 4-1 lists some typical objections, the underlying error made, and potential counterpoints to make for each.
Table 4-1—Typical concerns that may be posed before you get started, the error behind each objection, and arguments you can make against them.
Objection
Error
Argument
We don’t have time or budget.
Creating diagrams takes too long and is expensive.
Mapping needn’t be expensive or time consuming. Even a formal project can be done in a few weeks for about the cost of a usability test or marketing survey.
Each department has its own process map.
Functional silos work efficiently individually.
Fine. But do they show interaction across channels and touchpoints? Great customer experiences cross our department lines.
We already know all of this.
Implicit knowledge is enough.
Great—then we’re off to a good start. But by making that knowledge explicit, we can keep the conversations going. Also, we don’t lose insight when someone leaves. And if someone new joins the team, we can ramp them up quickly.
I was in that target group. Just ask me what’s valuable.
Customers are viewed from an inside-out perspective rather than outside-in.
Your input will be invaluable to get an initial hypothesis. We want to supplement that with a grounded external perspective as well. That’s where the best insights for growth and innovation are found.
Marketing already does research.
Marketing and experience research are the same.
That’s a good thing, but not enough. We need to uncover unmet needs and unexpressed feelings and show them in the context of the overall experience.
Provide Evidence
Know the benefits of alignment diagrams outlined in Chapter 1. But also be able to provide convincing evidence to support your effort. For instance, find examples and case studies in the literature. Be able to point to those examples and integrate them into your discussion.
One such example is Forrester Research, a leading technology industry research company, that has been writing full reports on the benefits of customer journey mapping in particular. Locate their studies or similar reports that show strong evidence in favor of mapping.
Evidence on the return of investment is even more compelling. For instance, Alex Rawson and colleagues show concrete increases in revenue when companies design experiences end to end rather than optimizing individual touchpoints. In their article “The Truth About Customer Experience,” they write:
“Companies that excel in delivering journeys tend to win in the market. In two industries we’ve studied, insurance and pay TV, better performance on journeys corresponds to faster revenue growth: In measurements of customer satisfaction with the firms’ most important journeys, performing one point better than peer companies on a 10-point scale corresponds to at least a two-percentage-point outperformance on revenue growth rate.”
Mapping customer journeys, the authors conclude, provides the insight for the design of better experiences. This in turn contributes to revenue growth.
Finally, if possible, find out what competitors are doing. Search for competitors along with keywords like customer journey map or experience map. Showing that others are doing this kind of work goes a long way in convincing decision makers.
Find a Champion
Identify stakeholders who might best champion a mapping effort. The more influential, the better.
For external consultants, this may be a client with whom you have a longer, ongoing relationship. Internal employees need to know how to navigate decision making in their organization. In both cases a quick stakeholder analysis may help.
Run a Pilot Effort
If possible, run a small pilot project. Diagrams need not be complex or detailed to be effective.
Alternatively, try creating a diagram as part of another effort. For instance, if you are running a traditional usability test, add simple follow-up questions to elicit their steps in a given process. Map these together in a draft version of an experience map, and use that as a discussion point. Demonstrating value with first-hand results is often the most persuasive argument.
Create a Pitch
Finally, create a succinct statement that you can readily recite. Include the business problems you’ll address. Why should a decision maker invest in a mapping effort of any kind? Here’s an example pitch:
You’d like to grow beyond your current offerings. By mapping the entire experience, you’ll have a better understanding of the needs and emotions of new markets and segments quickly.
Mapping is a modern technique to improve customer understanding that more and more companies are using, such as Intel and Microsoft.
By visually aligning various aspects of the customer experience with business processes, you’ll be able to see how to best create and capture value across channels. It will also yield insight into innovative products and services that outperform competitors.
With relatively little investment, mapping provides you with the strategic insight we need in today’s fast-changing marketplaces.
Decide on a Direction
There are several questions to answer from the outset of a project. These may be a simple matter of self-reflection, or they may need investigation. The two key areas of concern to address are the organizational goals and the types of experiences you should map. After determining those, select the appropriate diagram to create.
Identify the Organization’s Strategy and Objectives
Remember: alignment diagrams must be relevant to the organization. They need to answer open questions or fill current gaps in knowledge. Diagrams are most effective when congruent with the organization’s strategy and objectives
Some questions to explore in this step are:
What is the mission of the organization?
How does the organization create, deliver, and capture value?
How does the organization want to grow?
What are the strategic goals?
What markets and segments are served?
What are the gaps in knowledge?
Determine Which Experiences to Map
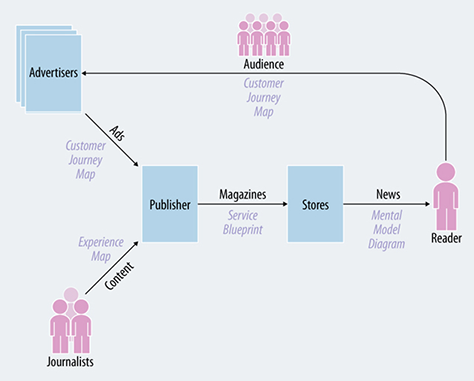
Most organizations have relationships with multiple parties: suppliers, distributors, partners, customers, and customers’ customers. To determine what experiences to map, first understand the customer value chain: a depiction of key actors and the flow of value to individuals.
Figure 4-2 shows a simple example of a customer value chain for a news magazine. In this diagram, journalists provide content to publishers, who make money from advertisers. Stores distribute the publisher’s magazine to readers, who form the audience for the advertisers.
Figure 4-2—This example customer value chain for a news magazine shows the flow of value to end consumers.
Overall, value flows from left to right in this diagram, from journalists to readers.
Customer value chains are similar to what are also referred to as stakeholder maps or ecosystem maps. You may come across these terms in other sources on mapping. The difference here is the inclusion of the flow of value.
There is no right or wrong way to create customer value chain diagrams. They are simple concept maps of the actors and entities involved in an experience. Ultimately, it’s about coming up with a model the fits your purpose. The process is straightforward:
List all actors and entities involved in the experience being investigated.
Place the primary actor and primary provider in the center, with the provider to the left.
Place other actors and entities around the two in a way that shows their basic relationships.
Finally, reorder the elements as needed to show how value moves from providers to customers.
Once completed, use the customer value chain map to examine various relationships that are possible to map. For instance, in Figure 4-3 the relationship of the advertiser to the publisher is unlike that of the publisher’s relationship to the stores. And the relationship of the journalists to the advertisers is different from the readers to the store.
A customer value chain helps set expectations with your clients. You can clarify which experiences to map and which to exclude. For instance, in the previous example, if the publisher is interested in learning more about the distribution of magazines to stores, and you were considering mapping the relationship of readers to advertisers, there’s a mismatch in expectations.
Customer value chains can generally be completed quickly—in a matter of minutes in some cases—and it’s worth the effort to get a view of the ecosystem. This will help you scope the effort, select an appropriate diagram type, and also guide recruiting for research.
Figure 4-3 also indicates some possible diagram types that might best illustrate the relationship. A service blueprint makes sense to map the relationship between the publishers and the stores to help optimize backstage processes. But a customer journey map might be better to illustrate the experience readers have with advertisers. And from the publisher’s perspective, an experience map could be a good way to understand the journalist’s relationship to the magazine’s content.
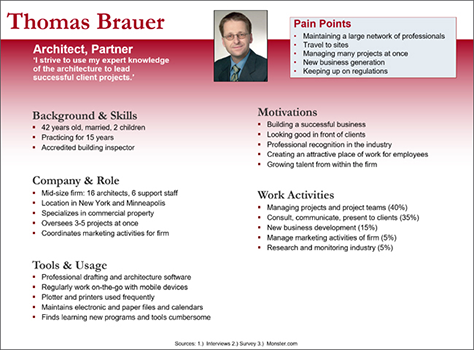
Figure 4-3— This example shows a persona for an architect.
Key questions when determining which experiences to map are:
Which relationships in the customer value chain do you want to focus on?
What point of view do you want to understand in that relationship?
Which types of users or customers are most relevant?
Which experiences are most appropriate to include?
Where do those experiences begin and end?
Create Personas
Personas are narrative descriptions of user archetypes reflecting common patterns of behavior, needs, and emotions. They reflect details about a target group in a way that is easy to grasp.
Personas are generally short—not longer than a page or two each. Figure 4-3 shows an example of a persona document I created for a past project.
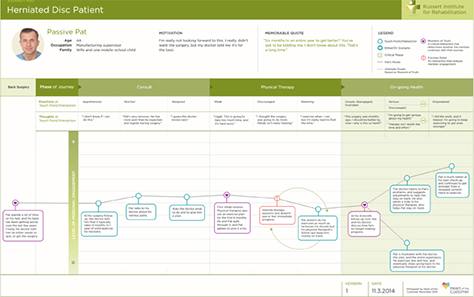
When you’re illustrating a specific person’s experience, it’s common to include the persona or a shortened form of it on a diagram itself. For instance, Figure 4-4 shows a customer journey map created by Jim Tincher, founder of the Heart of the Customer, a consultancy specializing in journey mapping. In this example, you can see the persona of Passive Pat along the top of the diagram. It reflects basic demographic information, motivations, and a quote Pat might say.
Figure 4-4—Diagrams often represent a persona at the top, as seen in this example of a customer journey map.
Creating personas is not creative writing. Personas should be based on actual data. The process consists of the following steps.
Identify the most salient attributes that distinguish one segment from another. You can usually find three to five primary attributes to focus on.
Determine the number of personas that you need to represent the range of attributes included. Collect data that supports and describes those attributes. Of course, your investigation may reveal new attributes to include along the way.
Draft the personas based on the primary attributes. Also include some basic aspects to flesh out the persona such as demographics, behaviors, motivations, and pain points.
Finalize the persona. Create a compelling visualization of the persona on a single page. Develop various formats and sizes for different contexts.
Make the personas visible. Hang them up in brainstorming sessions and include them in project documents. It’s your job to make them come alive.
Of course, creating personas is also a collaborative process. Include others so that the resulting documents are reminders of shared knowledge.
Proto-personas
Creating formal personas can be a lengthy endeavor. If you don’t have existing personas or the scope to create them, rely on proto-personas, a term coined by Jeff Gothelf, author of Lean UX. He describes them as follows:
“Proto-personas are a variant of the typical persona, with the important difference that they are not initially the result of user research. Instead, they originate from brainstorming workshops where company participants try to encapsulate the organization’s beliefs—based on their domain expertise and gut feeling—about who is using their product or service and what is motivating them to do so.” *
* Jeff Gothelf. “Using Proto-Personas for Executive Alignment,” UX Magazine (May 2012).
Proto-personas are lightweight representations of actors in the value chain that don’t require you to go through a costly research process. They are depictions of who you believe your target audience is, based on what you know today. They are also sometimes referred to as assumption personas or provisional personas.
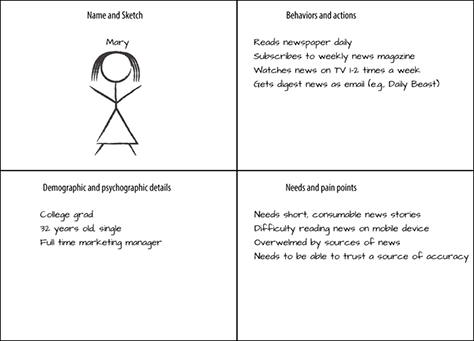
Proto-personas can be created on a simple grid with four squares, as shown in Figure 4-5. There are four main elements:
Name and sketch—Pick a name that is memorable and include a sketch of what the person might look like or find an image representing them.
Demographic and psychographic details—Include only those factors that are relevant to the subject at hand.
Behaviors and actions—Briefly indicate the key behaviors the person takes in the field you’re focused on.
Needs and pain points—Indicate what the person needs and what difficulties he or she encounters.
The proto-persona gives the team an easy way to refer to the individuals involved in the mapping effort early on. Instead of saying reader, you can refer to Mary, for instance. Fully fledged personas can then be created later as the project unfolds, if needed, after you’ve completed more in-depth research.
Figure 4-5—The template for creating quick proto-personas is simple. Use it to represent the actors in the customer value chain you’ll be targeting.
Select Diagram Type
The diagrams included in this book have a similarity: they all focus on value alignment. But recognizing the differences between them allows you to apply an approach that makes the most sense for your situation. Don’t rule out any one technique over another a priori.
After understanding the organization’s objectives and the experiences you want to map, select the type of diagram that’s most appropriate. To do so, consider the primary elements of mapping discussed in Chapter 2.
Table 4-2 summarizes some of the common diagram types and the differences between them along these dimensions.
Table 4-2—A comparison of different diagram types along the various elements of diagrams.
Type
Point of View
Scope
Focus
Structure
Uses
Service blueprint
Individual as the recipient of service
Concentrated on service encounters and ecosystems, frequently in real time
Real-time actions, physical evidence across channels
Emphasis on service provision, including roles, backstage actors, processes, workflows
Chronological
Front-line personnel, internal teams, and managers to improve an existing service or brainstorm new ones
Customer journey map
Individual as a loyal customer, often making purchase decision
Usually from becoming aware, through purchasing, to leaving a company and returning
Emphasis on cognitive and emotional states of the individual, including moments of truth and satisfaction
Chronological
Used by marketing, PR, sales, account management, customer support, brand managers for optimizing sales, customer relations, and brand equity
Experience map
Individual as an actor behaving in the context of a broader activity
Beginning and end by definition, given by the specific experience or context
Emphasis on behaviors, goals, and jobs to be done
Typically includes actions, thoughts, feelings, pain points
Chronological
Product managers, designers, developers, strategists; used for product and service design improvements, innovation
Mental model diagram
Individual as a thinking and feeling human within a given domain
Breadth of experience by definition, emerges from the data
Emphasis on fundamental motivations, feelings, and philosophies
Hierarchical
Product managers, designers, developers, strategists; used to gain empathy for individuals; inform product and service strategy and innovation
Spatial map
Individual as part of a multifaceted system of interaction
Given by the size, capabilities, and constituents of an organization
Highlights the flow of information and relationships between various aspects and components of a system
Spatial
Useful to managers, content specialists, employees to understand the flow of information for optimization and process innovation
How Many Diagrams Are Needed?
People often ask me how many diagrams they should create. To some degree this depends on how you’ve framed the effort. There is no clear-cut answer.
A diagram of the entire experience may not reflect a single persona’s experience, but rather aggregate all possible experiences in one map. To show the detail of someone’s individual journey, on the other hand, you’ll need a separate diagram for each target segment. Refer to the customer value chain and determine the difference in relationships you’re mapping.
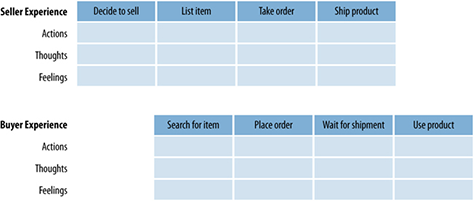
For instance, eBay may target two distinct experiences: those of buyers and those of sellers. One approach to mapping would be to create separate diagrams for each. It’s possible to illustrate separate experiences as two interlocking experiences, as shown in Figure 4-6.
Figure 4-6—It’s possible to align different experiences that overlap in two separate maps within a single document.
If the scope of your effort, however, focuses on sellers only, you may still need to consider different types of experiences. For instance, casual sellers on eBay have significantly different experiences than professional sellers. Two different diagrams are probably needed in this case.
In the end, it really depends on the factors detailed in Chapter 2: point of view, scope, focus, structure, and use. Generally there’s a desire to reduce your effort as well as the number of artifacts you create. So, I advise creating multiple diagrams only if necessary to illustrate significant differences.
What’s the Difference? Customer Journey Maps, Experience Maps, and Service Blueprints
The types of diagrams most often conflated are customer journey maps, experience maps, and service blueprints. These are all chronological maps, so the mix-up is understandable: they have a similar form and similar use. But there are distinctions between these commonly used diagrams.
A key difference is the point of view and the relationship of individuals to the organization.
Customer journey maps typically view the individual as a customer of the organization. There is often a decision involved: to purchase a product or service and become a loyal customer. Service blueprints view how a service—usually a real-time encounter—is experienced by a customer. Both diagrams seek to show how the customer fits into the services provided by the organization. Experience maps, on the other hand, look at a broader context of human behavior. They reverse the relationship and show how the organization fits into a person’s life.
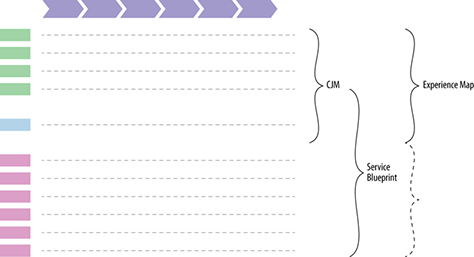
Breadth and depth vary for each as well, providing a different focus. Figure 4-7 shows a skeleton for a generic chronological map. The chevrons at the top show phases of interaction. The top half represents a description of the individual’s experience, and the bottom represents the service an organization provides. In the middle are touchpoints.
Figure 4-7—Depth and breadth differ across diagram types.
Customer journey maps tend to focus on the experiential side of the equation, with only a brief description of the service provision processes. Service blueprints focus on the backstage processes. An experience map focuses on the broad customer experience but could also include detailed descriptions of the organization’s actors and processes.
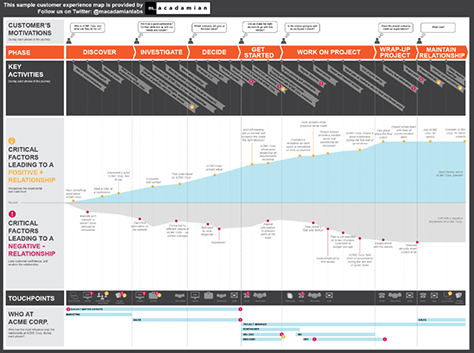
Contrasting examples of each are shown in the following three figures to illustrate these differences. Figure 4-8 shows a customer journey map created by Macadamian, a full-service software and design firm. The rows in the center of this map clearly focus on the positive and negative experiences of the individual as a customer of the organization. There is a decision point in the middle of the journey.
Figure 4-8—This customer journey map for a fictitious company, Acme Corp, focuses on positive and negative emotions.
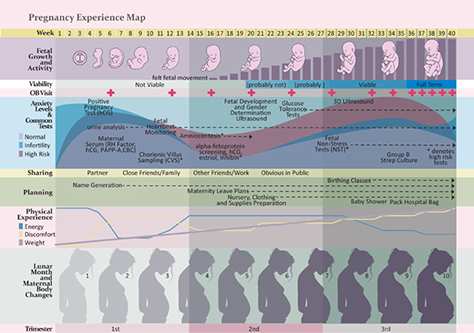
The next example (Figure 4-9) is an experience map for pregnancy. This was created by Beth Kyle, a Senior Technical Analyst at Cornerstone Information Systems, during her graduate work in Human-Computer Interaction at Indiana University.
Figure 4-9—This pregnancy experience map created by Beth Kyle focuses on a human experience.
The focus here is on human experience, not on a particular company or business. There is no purchase decision or point of purchase. The organization in this case is not explicitly represented, but implied. As a result, multiple organizations could benefit from this diagram, such as a doctor’s office or a pregnancy planning service.
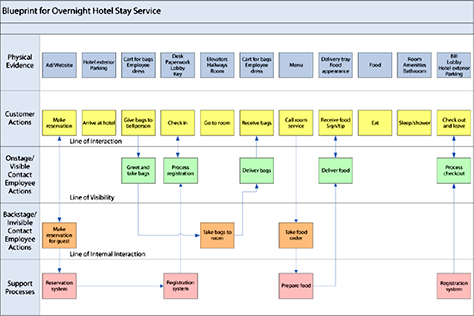
Service blueprints tend to focus on real-time interactions. They typically show more detail of the backstage service provision mechanisms and lack depth in describing the person’s experience. Figure 4-10 shows an example of a service blueprint created by Mary Jo Bitner and colleagues from their landmark article “Service Blueprinting: A Practical Technique for Service Innovation.”
Figure 4-10—This service blueprint for an overnight hotel stay was created by Mary Jo Bitner and colleagues.
Understand the nature of the diagram type you are targeting before beginning an effort. But don’t get hung up on labels— they are less important at the end of the day. Instead, focus on how you’ll show value alignment visually to engage others in your organization in a conversation.
Define the Effort
Once the overall direction of the effort is outlined, assess the amount of time needed and approximate costs. In this step you’ll also want to ensure you have the appropriate skills, equipment, and resources.
Estimate Duration
The time frame for mapping efforts varies greatly. It depends on the formality of the project, type of map you’re targeting, and the depth of information it contains. Small startups, for instance, may be able to quickly create a map in a matter of days. Formal projects typically run anywhere from a few weeks to a few months in duration.
Below are some relative time frames of various types of efforts to give a rough sense of durations.
Rapid effort—one to two days
Short, full project—one to two weeks
Average initiative—three to six weeks
Generous program—more than six weeks
The time estimate is primarily a factor of the extent of your investigation, as well as how many revision cycles and meetings with stakeholders are needed.
Assess Resources
The primary resource needed for a mapping effort is staff time: someone to do the investigation, create a diagram, and facilitate workshops.
Skills needed to complete a diagram include:
The ability to organize a wealth of information and abstract concepts
The ability to collect data and conduct primary research
The ability to model and visualize complex information
Other project requirements include:
Access to internal employees. You will need access to internal members of the organization. Multidisciplinary teams are ideal. Diagrams are not a give-and-go deliverable: they necessarily involve people within the organization throughout the process. Their active participation is required.
Ability to recruit customers. You will need the ability to recruit external participants in your research activities (as outlined in Chapter 5).
Ability to travel. Depending on your industry and location of target groups, some travel may be necessary for research.
Transcription service. Finally, depending on your research approach, you may want to record interviews with participants and have them transcribed.
Estimate Costs
Costs can vary greatly. Table 4-3 shows high and low estimates for an alignment project. The main driver is the staff month estimate. This will vary depending on your resource cost per month. The high estimate assumes one person working two full months. The low estimate assumes a person completing the project in two weeks.
Table 4-3—Example of high and low cost estimates for an alignment project. Figures can vary greatly in both directions, depending primarily on the cost of a staff month.
High
Low
Staff Month
2 × $15,000 = $30,000
.5 × $15,000 = $7,500
Incentives
10 × $50 = $500
6 × $25 = $150
Transcriptions
10 × $150 = $1500
None
Travel
$500
None
TOTAL
$32,500
$7,650
Of course, it’s also possible to have larger or smaller efforts. These estimates are just median guidelines to give a sense of approximate cost ranges.
Write a Proposal
Informal efforts may not require a proposal at all. Formal projects will likely have a written statement of intent. Don’t be put off. A proposal need not be time consuming or extensive. Keep it light by simply listing responses to each of these elements:
Motivation. Include the reason why you’re embarking on the project with the organization at this time.
Aim. Include a statement about the aim of the effort and the overall timeline.
Goals. List the objectives and measurable outcomes of the project.
Project participants. List everyone involved and their roles. Mention that you will need access to internal stakeholders and their involvement throughout.
Activities, deliverables, and milestones. Describe the sequence of activities and the expected outputs.
Scope. Indicate the experiences you’re intending to map. You can determine these from the customer value chain, like the one shown in Figure 4-3.
Diagram type. If you have a target diagram type in mind, indicate that in the proposal.
Assumptions, risks, and constraints. Highlight aspects of the project that may be out of your control, as well as the factors that may constrain the effort.
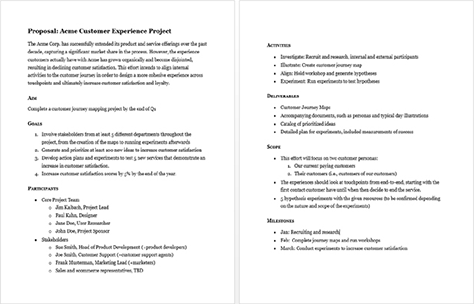
In total, a proposal doesn’t have to be more than two pages. See an example in Figure 4-11.
Figure 4-11—A proposal for a mapping project does not have to be long.
Summary
Initiating a mapping project begins by framing the effort. Start by assessing the required level of formality. Generally, larger organizations striving to design holistic experiences across a system of touchpoints have a greater need for a formal effort than an individual person designing the interface of a single product.
Both internal employees and external consultants may need to overcome potential barriers to get started. Know the objections and be prepared with evidence to make convincing counterarguments. Also, identify a champion to pilot a project with. Demonstrating first-hand results goes a long way toward winning over others.
The concept of alignment diagrams opens up possibilities for you: there is more than one way to address a given problem. You’ll need to understand the organization and its goals to shape the effort in the way that has the most impact.
It’s up to you to determine which experiences to map. Examine various relationships in the customer value chain to narrow down possibilities and set the right expectations. Then select the diagram type that is most appropriate. Again, there are no right or wrong answers here. You’ll have to form a perspective that works best for your situation.
For formal efforts, define the project and summarize it in a written proposal. This should include motivations, goals, participants, resources, and approximate costs of the project. Be prepared to negotiate the details of the proposal with stakeholders to arrive at an appropriate, well-defined effort. Informal efforts may not require a proposal or much documentation at all.
Further Reading
Tim Brown. Change by Design (Harper, 2009)—This full-length book is the definitive work on design thinking. Based on years of experience at IDEO, one of the most innovative companies in the world, Brown lays out an argument in favor of design thinking in detail. The theories are grounded in stories and case studies from the field. Though mapping plays only a minor role in the book at best, it advocates a change in organizational perspective—one that favors empathy for users and a general outside-in philosophy core to alignment diagrams.
Ram Charan. What the Customer Wants You to Know (Portfolio, 2007)—Ram Charan is a highly acclaimed business leader, having worked with top executives at Fortune 100 companies. He is able to make business concepts very accessible. This book discusses value creation from the customer’s perspective in detail, including specific aspects such as customer value chains.
Forrester Research—Forrester has been researching and publishing reports about customer experience and journey mapping for nearly a decade. To find reports, search their website for customer journey and customer journey mapping or similar terms. Be warned: these are expensive, with each report costing hundreds of dollars or more.
Alex Rawson, Ewan Duncan, and Conor Jones. “The Truth About Customer Experience.” Harvard Business Review (Sep 2013)—This is an excellent article on the value of end-to-end experience design, appearing in a leading business magazine. The authors mention mapping activities only briefly and provide no details on how to create them. They do, however, provide hard evidence on the positive effects of end-to-end experience design on the bottom line. Citing articles like this one can help convince stakeholders to embark on a mapping project.
A noted author, speaker, and instructor in UX design, information architecture, and strategy, Jim is currently Head of Customer Experience at MURAL, a leading online, digital whiteboard. He has worked with large companies such as eBay, Audi, SONY, Elsevier Science, LexisNexis, and Citrix. Before returning to the US in 2013, Jim lived in Germany for 15 years, where he cofounded the European Information Architecture conference and IA Konferenz. He served on the Advisory Board of the Information Architecture Institute in 2005 and 2007. Jim is the author of two O’Reilly books—Designing Web Navigation (2007) and Mapping Experiences (2016)—and the Rosenfeld Media book The Jobs to Be Done Playbook: Align Your Markets, Organization, and Strategy Around Customer Needs (2020). He enjoys playing jazz bass at jam sessions and with jazz combos in Jersey City. Read More
 One of the most common questions I get in my workshops on mapping is, “How do I begin?” Aspiring mapmakers may see the immediate value in these techniques, yet they have barriers getting started.