A number of myths surround media use: Some claim that people no longer read, while others argue that there is no substitute for reading the news, especially for commuters. Others claim that readers have switched over to social networks, so publishers should now forget about media Web sites and focus instead on posting to news feeds. Still others believe that the readers of Web publications continue to open the main page, then thoughtfully and consistently read through new articles.
Certain editorial metrics—such as scrolls, engagement, and conversions from visitors to readers—offer some insights into how people use and communicate with online media. Statistics make us aware of what topics and content engage readers and what layout patterns actually work. We know how specific types of users respond to particular articles. But, still, all of this data gives us little insight into the role online media play in readers’ lives.
Champion Advertisement
Continue Reading…
We conducted a diary study to get a real picture of online media use and understand readers and their habits. To see media through users’ eyes and better understand what, why, when, and how people read, we literally had to look at users’ screens. We wanted to get answers to the following questions:
How often and how long do people read online?
Do people really read at all? Or do they just skim through posts?
How do readers select articles to read out of the general information flow?
What holds readers’ attention? What editorial practices actually work?
What are users’ information consumption strategies?
Media Use Strategies
When looking at how people use media, we noticed that people have very individualized reading habits. Their information-consumption strategies include what Web sites they go to for information, how they select what they want to read, whether they scroll, how long they view articles they’ve opened, and whether they follow links in content. We identified four different strategies for media use based on our study results.
Strategy 1: Life in the Feed
Active media use through social-media feeds is the key characteristic of Strategy 1. Feeds are not the only source of information for these people, most of whom use feeds to find publications. In addition to social media, they also use services that aggregate media sources and news feeds—such as Feedly and Yandex.News.
Users consume the information in news feeds in three different ways:
Scanning—quickly identifying pictures and headlines in the feed
Skimming—reading quickly, while scrolling
Reading—reviewing the content in detail
Standard Interaction
Users open and view the feed, click links to read articles, then return to their feed.
Details
One of the ten respondents focused on the information in headings. In most cases, feeds are rich in content, so users are quite content just reading the heading and summary to grasp the meaning of an article. This is particularly true of news articles, for which users see no need to click links and open articles. The users of feeds consume large amounts of information.
During the monitoring period, no respondents added any new resources to their feed. They had all selected their information sources long before our study. Now, they just choose what they’ll read from a well-established information flow in their feed. New information sources apparently have difficulty penetrating this established market.
Strategy 2: Monitoring Selected Sources
When following Strategy 2, people obtain information from a limited number of selected sources. Readers go directly to their trusted, favorite sources to check for any new updates.
During our interviews with respondents, we asked, “What kind of media do you include in your list of selected sources? Users select media with an editorial policy that appeals to them and authors they consider to be “experts in their field.”
Standard Interaction
Users go to the home page of the selected resource, view it, then either look over the lists of recent or top articles and read a few interesting articles, following contextual links; or navigate to other sections of the Web site.
Details
These users read media regularly, but their activity is relatively low—that is, they don’t read much or for long periods of time. Typically, these users visit one or two Web sites a day and read about five articles for five to ten minutes. Their level of engagement is not deep. Respondents viewed or read only the top articles on a Web site.
Strategy 3: Reading Everything and Anything
Users who employ Strategy 3 spend their free time reading media.
Standard Interaction
Users open news feeds or their favorite Web sites, then follow links from one article to the next, traversing hypertext links on Web sites.
Details
There was no clear trend in these respondents’ use of information media. They simply follow interesting links to whatever appeals to them. These users scroll through Web sites whose theme or style appeals to them—for example, sites that post a lot of scandals and tabloid articles about celebrities.
Strategy 4: Searching for Specific Information
Another media-use strategy is searching for additional articles on a particular topic. Users who follow Strategy 4 seek more information on the same subject, either to find out more details or compare information from several sources.
Standard Interaction
Searching typically starts with breaking news—either postings on social media or the news—for example, election results. Users search for a topic, then select relevant articles from their search-engine results.
Details
These respondents interacted with search results repeatedly, viewing the first article in the results, going back to the search engine, then viewing additional articles. They may refine their query to see more relevant articles on the topic. Then, they look for more details about what they found out by reading. These users pay attention to publication sources when selecting which search results they want to follow.
Time People Spend Reading Media Online
We measured how many times a day our respondents read the media, how many publications they opened, and how much time they spent on mass-media Web sites. Respondents’ reading activity varied widely, as shown in Table 1.
Table 1—Time spent reading
Minimum Average
Maximum Average
All Respondents
Average
Median
Minutes per reading session
5
154
62.5
63.25
Sessions per day
0.5*
10
3.9
3.4
Publications per day
1.3
32.3
12.5
8.75
* The user consumed media once in two days.
The number of reading sessions per day ranged from one to ten. Three of the ten respondents read media once or twice a day; four read media four times per day; and two read media five to seven times per day. One respondent read news media at least ten times a day.
Users opened different numbers of publications during one session—from three to 30. Each reading session might last from ten minutes to one and a half hours.
Recorded reading times were as follows:
10 minutes—2 respondents
20 minutes—1 respondent
one hour—2 respondents
one to one and a half hours—3 respondents
more than one and a half hours—2 respondents
Comparison of Study Results and Mediator Data
Mediator, a Russian editorial-analytics system, records two parameters:
Expected article reading time—This is the amount of time users would spend reading a piece of content attentively and consistently. Mediator calculates this reading time by the number of words in the text. Thus, the longer the material, the longer the expected reading time.
Real engaged time—This is the amount of time users spend actively interacting with a piece of content—that is, reading text, viewing a video, or interacting with content in some other way.
According to Mediator, the average expected reading time for regional media is 2:09 minutes. The average real engaged time is 1:09 minutes on desktop computers and 1:03 minutes on mobile devices.
Typical metrics for news and information feeds are as follows:
expected reading time—2:16 minutes
real engaged time—1:17 minutes for desktop computers; 1:12 minutes for mobile devices
The metrics for online media content and entertainment—such as media about finance, games, sports, fashion and beauty, and traveling—are as follows:
expected reading time—5:08 minutes
real engaged time—2:15 minutes for desktop computers; 2:08 minutes for mobile devices
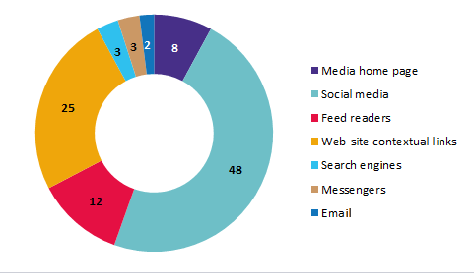
Figure 1 shows the percentages for various traffic sources from which users navigate to publications, as a percentage of all visits to an article page. Detailed information regarding respondents’ entry points when reading follows.
Figure 1—Traffic sources
Social Media: 48%
Our study combined social-media links and Facebook Instant Articles that users opened and read. Facebook generates significantly more clicks to media sites than Vkontakte, whose posts tend to be much more personal.
Web-site Contextual Links: 25%
Web-site contextual links include links to contextual pieces of content, links at the end of an article to other publications, links to other sites, and banner links. Many of these links take readers to additional articles on the same media site.
During the study, users opened 25% of the articles they read by following such Web site links. However, this figure is probably inflated because of the behavior of one particular respondent, who is an active media user and goes deep into Web sites, resulting in a lot of navigation actions. Without this user, the figure for contextual links would have been 14% of all articles the respondents opened. But even so, contextual links are the next most common point of entry to publications after social media. This metric demonstrates how media sites manage to retain their users.
Feed Readers: 11%
These services aggregate publications based on a user’s preferences and are another common way in which users navigate to media sites. Three respondents used the Yandex.News personal section and one used Feedly.
Media Home Page: 8%
Only a few users navigated directly to media sites—that is, typed their Web address in a browser or used bookmarks. Only the respondents who regularly monitor selected sites start reading from a site’s home page. Respondents who followed other reading strategies also navigated directly to media sites, but much less frequently. As a rule, they went directly to the most popular media sites. Our respondents went to Meduza, Vedomosti, Kommersant, RIA Novosti, The Village, and Mail.Ru News. Only one of the ten respondents navigated directly to a less popular site, Worldcrisis.ru.
Messengers: 3%
Only two of the ten respondents followed links to media sites from messengers. One respondent discussed the State Duma elections with friends in a group chat. The group actively shared links, and this respondent clicked some of them. Another respondent is a Telegram subscriber for professional topics, but does not a view messages regularly—sometimes leaving new messages unread for three or four days.
Search Engines: 3%
Users navigated to media sites from search engines when they needed additional, related content from publications. Most were looking up unknown terms or wanted more details on news articles.
Email: 2%
Respondents used email to navigate to media sites only when they had subscribed to mailing lists for specific content—for example, on education, petitions, or children. Each respondent started reading according to his or her own personal media-use strategy. All respondents used their favorite entry points—such as social-media feeds, email, or the home pages of selected resources. Their use of other sources to navigate to media sites were exceptions to the rule. Figure 2 shows the most common scenarios.
Figure 2—Personal entry points for reading
Conclusions on Entry Points
Most readers use social media as a window into online media.
Media home pages get very little use—only a few readers use them to navigate further into a Web site.
Messengers are not yet a meaningful media-use channel.
Every reader has one or two entry points from which they usually start to read online. They stick to their habits.
A large number of users following links in articles demonstrates that users find a media site engaging.
Comparison of Study Results and Mediator Data
Mediator, the editorial-analytics system we mentioned earlier, also tracks the Web sites from which users navigate to read articles and how users engage with different sources. Social-media metrics show the reading habits of users who navigate from Facebook, Vkontakte, and Odnoklassniki. The search metrics show the habits of users who come from Yandex, Google, Mail.Ru, Rambler, Yahoo, and Bing. Feed-reader metrics show news traffic in Yandex, Google, and Rambler.
According to Mediator, over a period of two months, an average of 737 people viewed each article on various regional-media sites that use the Mediator service. These include 166 readers from social media, 19 from search engines, and six or seven from feed readers.
News and information media have the following metrics: 2,810 content views on average, including 426 from social-media traffic, 124 from search engines, and 39 from feed readers.
For content and entertainment resources: 883 content views on average per piece of content, including 331 from social media, 200 from search engines, and seven from feed readers.
When users look through social-media feeds or feed readers, they see dozens of articles, but they choose to click, then read only a few of them. How do users select what they want to read and when to scroll?
Content That Always Sparks Interest
Certain types of content always tend to spark the interest of particular readers. But it’s the habit of some readers to avoid uninteresting topics instead. Such readers filter out or ignore topics they are unwilling to read about. For example, one respondent skipped all the news about a scandalous photo exhibition, even though it appeared often in his news feed. Another respondent who subscribed to Western news feeds ignored all publications relating to the US presidential elections.
Content on Which Their Interests Focus
Most publications that respondents opened to read focused on a particular topic of interest. Every respondent’s areas of interest are unique—for example:
devices and gadgets, popular science, design
personal relations, children, celebrities
national politics, the economy
The most common filter was their professional filter. Job-related content always garnered increased attention, with a high probability that the user would open and read it. For example, one respondent was interested in journalism and media markets and opened articles on the following topics:
penalties imposed on journalist A. Nosik
preview of a book authored by a well-known editor
Web analytics
Google’s recent developments
joint development of a travel Web site by a team of journalists
Whatever Is on Today’s Agenda
Some users never miss breaking news, expected events, accidents, or any other similar news items. During the study period, almost all users read about the elections, Angelina Jolie and Brad Pitt’s divorce, the Emmy Awards, the Ig Nobel Prize, and the scandalous photo exhibit of Jock Sturges.
Reading news often compels users to search for additional details or follow news feeds, but focused, insightful study of a subject is a rare exception, with only one respondent who had this news-consumption habit.
Indecent, Frightening, or Humorous Content
Publications like these always garner attention—particularly those with humorous content. As a rule, reading their content does not take a lot of time or effort, and people often view these sites.
What Prompts Users to Read on Social Media
When viewing their feeds, users select articles as if they were applying certain filters, as follows:
by post author—They read some authors more often than others. When users notice a relevant name in their feed, they immediately open the post or click the link.
by community—They read content for particular communities or groups. Or they may avoid publications for certain communities.
by image—Videos, images, and photos attract users when they browse their news feeds quickly.
Users apply these filters at different rates. If a user sees a publication by a favorite author in the feed, he’ll click it immediately. Filters for indecent, frightening, or funny news also work very quickly. In contrast, readers’ selection of content articles happens more slowly—probably because the content requires some assessment before their choosing to read it.
Conclusions on Article Selection
Readers select articles that interest them, either intentionally or unconsciously.
Users are also attracted to articles that relate to the top news items of the day. Most people read the news. Although some people ignore posts relating to certain topics.
Indecent, frightening, and funny posts attract spontaneous attention, especially during leisure time. Engaging with or understanding such content requires no time or effort, and this content excites people’s curiosity.
Users consider publication sources important. Respondents quickly follow links to content that has been posted by media, groups, or people they find credible, then determine whether the content is interesting to them.
Illustrations, videos, and photos immediately appeal to viewers.
How People Read
As we observed in our study, people exhibit different reading behaviors and habits.
Reading Behaviors
Scrolling to the End of Articles
80% of our respondents scrolled to the end of articles—that is, through 100% of the articles. The scroll depth for the other 20% averaged 1.7 times the screen height on the desktop and about 2 times the screen height on mobile devices. The scroll depth indicates the point at which users decide they are not interested in reading further. We expected to see a larger difference in scroll depth between desktop and mobile users, but, in the end, found no significant difference.
How Much of an Article Users Read
On average, users read 66% of an article. Scroll depth—the part of the article a user scrolled through or viewed to decide whether to read—is not related to reading depth—the part of the text users actually read. Users may read only a small fragment of an article, even though they’ve scrolled all the way to the end.
Our study showed an impressive reading depth. Users usually read more than a half of an article’s text. More precisely, users read 66% of the text on the desktop and 71% on mobile devices. Thus, when users open an article, they are likely to read more than a half of it. Figure 3 shows reading depth on the desktop, as a percentage of all visits to an article page.
Figure 3—Reading depth on the desktop
The same moderator assessed each respondent’s reading depth, at the same reading speed. Therefore, we can state that we have assessed their actual reading depth rather than just their scroll depth. Plus, because moderators also viewed any videos, they could understand the reading speed of each respondent. In this way, they could observe the differences between fast and attentive reading.
Mobile Users Read Full Articles
We were concerned about how the device on which a user was reading—desktop or mobile—would affect reading depth. So we calculated reading depth for desktop and mobile-device users separately. We discovered that people reading on mobile devices read more articles to the end. When using mobile phones, users either navigate away from an article without reading any of it or read it to the end. Desktop users typically read just the beginning of an article—about the first fourth—then navigate away.
Reading Habits
Our study identified three main reading habits:
Attentive reading—Most respondents read attentively, reading the texts of articles in full, without exceptions. When people read attentively, they scroll a page at the same speed throughout the entire article.
Selective reading—This reading habit involves attentive, but fragmented reading. Users skip some text blocks, but attentively read those that they choose to read. Selective reading is common when reading publications that consist of independent conceptual blocks or when users first read for meaning, then skip any uninteresting fragments. Selective reading is easy to identify by a user’s irregular scrolling speed. Users scrolled through some parts of the text so quickly that the moderator had no time to read them at all, while other parts were easy to review. Selective reading is the second most common habit and is more common than scanning.
Scanning—Characterized by high scrolling speeds, this reading habit lets users absorb only certain important ideas. Text scanning is similar to the way users view social-media feeds. Users move quickly through an article, looking at only the most important things.
What Readers Read or Skip When Skimming
When users read the very beginning of an article, then close the article, this indicates that they found the article uninteresting, or it did not meet their expectations. For example, an article might not contain the information the synopsis described or it might actually be an ad, not editorial content.
When skimming, readers skip the introduction and final paragraphs, viewing them as non-essential content. You can identify this reading habit by a user’s scrolling speed. Readers stop reading once they believe they’ve captured the meaning of the article and are not interested in further details or developments.
Conclusions on Reading Behaviors and Habits
People actually read the text, they do not just look through it!
When people need to save time when reading, they prefer selective reading. Scanning is less popular.
Comparison of Study Results and Mediator Data
Scroll depth is the basic metric for assessing whether an article’s layout is acceptable. Mediator records the number of users who opened a page, began reading an article, then viewed one- or two-thirds of the article or scrolled to the end.
On average, 82% of desktop users and 72% of mobile-device users scroll to the end of regional-media articles. For news media, this metric is 73% for desktop users and 62% for mobile users. For entertainment media and other content sites, 63% of desktop users and 54% of mobile users scroll to the end of articles.
Mediator also records viewer-to-reader conversion rates for each article. What does this metric mean? Most media outlets rely most heavily on content-viewing data. This viewing data shows how many times users downloaded a page and how many users opened an article by following a link. But viewing is different from reading, and Web-site visitors are different from readers. When visitors load a page, they are not certain to read it. For example, they may be distracted from their computers before they can read the article, then close their browser. The system records one more view, but the user never read even a single line.
Readers are visitors who scroll through an article to the end, spending enough time to read it. Let’s take a look at how different media sources manage to convert visitors into readers. The conversion rate for regional media averages 30% on desktops and 39% on mobile devices; for news media, 40% on desktops and 43% on mobile devices; for entertainment media and other content sites, 38% on desktops and 39% on mobile devices.
Figure 4 shows what users do once they finish reading an article, as a percentage of all articles read. Detailed data follows.
Figure 4—How users finish reading
Readers Navigate Away from the Article: 39%
Most users simply close the browser tab containing the article they’ve just read. However, if an article was posted on social media, users will continue to look through their feed.
Readers Navigate Back to the Initial Site: 26%
In most cases, the initial site is a social-media feed, but sometimes it is the feed reader’s home page. This percentage includes readers finishing articles they’ve opened in a separate tab.
Readers Follow Contextual Links on the Media Site: 16%
In our study, few respondents followed more than two links on a single Web site. Only one respondent actively sought further content on the same Web site. This percentage must be adjusted according to the reader’s level of activity.
Readers Check Out the Comments: 3%
Sometimes, when users finish reading an article, they’ll pay attention to the comments, without clicking links within them.
Readers Look for Additional Related Information: 2%
If users encountered any unknown information, they continued searching to find out what it was all about. For example, one respondent sought more information about Sturges and his works after reading the news about his exhibition. If an article mentioned a Web site, respondents were willing to visit the site once they’d finished reading the initial article.
Readers Finish Reading in Other ways: 11%
After reading an article, just a few respondents took other actions:
returned to the initial article—Only 2% of respondents went back to the initial article. For example, they may have stopped reading after following a contextual link or gotten distracted when looking for related information, but now want to go back to read the article.
shared a link to the article—Only 1% of respondents shared links on social media or a messenger.
liked the article—Only 1% of respondents liked articles. In general, users were not willing to add likes to media publications. Instead, they preferred to like only personal posts.
saved or bookmarked the article—Only 1% of respondents opened an article in a new tab, bookmarked it, or saved it on their device to read it later.
copied a fragment of an article—Just 0.3% of respondents copied content to a text document.
Conclusions on What User Do After Reading
Most users go back to the initial site—their social-media feed or feed reader—after reading an article they’ve opened—whether in the same or a new tab.
Few users share the articles they read.
Few respondents add likes to media articles, but instead, use this function only on personal posts.
A common thing for users to do after finishing an article is to follow contextual links.
Few users click more than two contextual links.
If users want to know more information about what they’ve just read, they’re willing to look for more related details. However, very few of the respondents in our study felt this need.
Comparison of Study Results and Mediator Data
Mediator recorded how many users shared links to an article on Vkontakte, Odnoklassniki, or Facebook. On average, these metrics showed the following:
35 of 737 visitors to the regional-media site shared the article.
515 of 2,810 visitors shared content on the news and mass-media Web sites.
297 of 883 visitors shared content-related and entertainment media.
Here are the details about how we conducted this diary study, including information about the respondents who participated in the study, as well as our methods of data collection and processing.
Respondents Who Participated in the Study
We invited ten respondents to participate in our study, each belonging to one of two groups: professionals or ordinary people.
The Pros
This group includes IT, mass-media, marketing, and public-relations (PR) professionals who consistently monitor news and other content. Media consumption is an important driver of professional competence because these people have to be in the loop. Reading is not just their focus, but part of their entire lifestyle.
A Professional Journalist
This professional journalist is currently working for a charity foundation and is 37 years old.
She reads whenever she has free time and also sets time aside specifically for reading.
She spends her time reading news feeds—mostly comprising media content.
She subscribes to large news-media agencies—including RBC, RIA Novosti, and Vedomosti—and professional groups for online journalists and the media market.
She has many friends who are journalists.
She consumes news by skimming the headings and usually gets the message from the title or feed synopsis rather than following the link. However, she is willing to follow links to articles relating to her profession and to social and environmental issues.
She frequently stays on her Facebook feed, on both her mobile device and her desktop computer.
A Journalism Student
This student in the Journalism Department at the Russian State University for the Humanities is 18 years old.
She spends a lot of time using her computer, actively using messengers when studying and reading books online. Reading media comprises five to ten percent of her total online activity.
She regularly visits Meduza, Mail.Ru News, and The Village to read the top news in the feed and the sections. After reading two or three articles, she closes the Web site.
She sometimes follows links in messengers.
A Media-Service Developer
This media-service developer is 24 years old.
He subscribes to top Western media, as well as professional content, reading a lot of that content.
He reads articles relating to science and gadgets on social media.
He reads in both Russian and English.
He reads on his mobile device, primarily when commuting, and at home at night on his desktop computer.
He often saves articles to read later at night or goes back to articles he has already begun reading.
Facebook is his main source for media consumption.
A Publication Department Head
This head of the publication department at a mass-media outlet is 28 years old.
He works with a dense information flow and must filter it.
He Googles to find content that interests him, ignoring content that does not interest him.
He often follows contextual links within articles.
His reading activity peaks in the morning, during the day. At night, he looks at articles “in the background.”
He rarely uses his smartphone for reading news, preferring to read on his personal computer.
He looks at Feedly and Twitter in the morning and uses Facebook during the day.
A Press Secretary
This press secretary is 34 years old.
His media use is spread out over time. He may go back to the same article several times during the day.
Facebook is his main source for media consumption.
His media use is above average, but not very high in comparison to other respondents from the professional group.
He reads media mostly on his desktop computer.
Ordinary People
This group includes ordinary people whose work is completely unrelated to IT or the media—for example, office staff members, creative intellectuals, and craftsmen. Their jobs or careers do not require constant information monitoring or insights into the market or politics. They use media when taking a break, relaxing, or killing time.
A Fitness Instructor
This fitness instructor has a law degree and is 29 years old.
She uses social media as her main source of media content, primarily consuming VK posts. She also uses Facebook—where she subscribes to entertainment content such as Lamp.im, Anews, and Fishki.net—and Instagram.
She does not follow the news, but views the top articles on the Yandex.Browser home page.
Her interests include ancient Russian history, religious beliefs, ceremonies, and magic. Plus, she said, “There is no life without cats” and “Vicious doctor” entertainment communities.
She consumes media content only on her mobile phone.
A Translator
This translator is 31 years old.
He performs a lot of his work online, looking for examples of word use on Web sites and watching training courses.
His media use is low, and he reads very little content.
He visits only Mail.Ru News, searches for posts relating to certain topics, and views some posts.
He performs a lot of work online, but reads much less.
A Housewife
This housewife has a child and is 31 years old.
She spends a lot of time reading, mostly in the morning and late at night.
She spends about the same amount of time reading on her smartphone and on her notebook computer. At night, she more often uses her desktop computer.
She begins reading from Yandex.News or AiF news.
She often follows contextual links on Web sites, browsing content for long periods of time.
She selects articles relating to celebrities, tabloid news, and shocking criminal news.
She spends a lot of time on VK, but her feed contains no media content.
Her reading sessions can last up to three hours
A Waitress
This waitress is 24 years old.
She stays online all the time, viewing her VK feed and posts, but almost never reads media news.
She uses very few information sources.
When consuming media, she reads only entertainment content.
A Sales Manager
This sales manager is 39 years old.
He likes reading news about politics and the economy, reads only about those topics, and consumes content on related subjects only from trusted sources.
He follows links from those trusted sources to other resources.
He searches Google for all unknown information he encounters when reading articles.
How We Collected the Data
For an entire week, we recorded interactions on the screens of the ten respondents’ mobile devices and desktop computers. We sent videos from smartphones and computers to the moderators once a day. In total, we recorded 254 hours of video, of which 83 hours are media-use sessions.
We allowed respondents to stop recording when entering personal data such as banking details or correspondence. We asked respondents to use this option sparingly and keep recording whenever they were viewing media content. Four of the ten respondents kept recording on throughout the entire testing period. This suggests that people are becoming less concerned about privacy.
How We Processed the Data
The moderators viewed all of the videos, noting the following:
media-use sessions
sources leading to media resources—For example, direct access, feed readers, social media, or messengers.
scroll depth—The distance down a page a user has scrolled. Moderators recorded how many screens users had scrolled through.
reading depth—The part of an article users actually read, not just looked through. By watching the videos, moderators were able to read articles along with the respondents. Judging by what a user managed to read before scrolling, a moderator could determine whether the user had read the entire text of an article and, thus, the percentage of the content the user read.
how users read text—Moderators observed whether users were attentively or selectively reading or scanning.
how users finished reading—After reading content, some users followed contextual links or shared articles on social media or messengers.
Olesya works in the UX Laboratory of the Mail.Ru Group, one of the largest Russian Internet companies. The Lab consults on all of the corporation’s projects. Olesya conducts UX research for various products, including games, services, apps, portals, email, and media.
Read More
Anna is a researcher in the UX Lab of the Mail.Ru Group. She employs a mixture of qualitative methods such as brainstorming, in-depth interviews, and diary studies to improve the usability of the products the Mail.Ru Group creates. She develops research designs, using the optimal approaches for each product. Anna has more than four years of experience in usability research. Before joining the Mail.Ru Group, she worked for the consulting company Usabilitylab. Anna is a graduate of Russian State University for the Humanities, where she earned a Master’s in Cognitive Science. Read More
Olga supervises the work of nine editorial professionals, introduces new formats, forms editorial policy, and is responsible for the team’s effectiveness. Read More