These excerpts are from a sample chapter from Erika Hall’s book Just Enough Research. 2013, A Book Apart.
Chapter 8: Analysis and Models
Qualitative analysis can seem like a mysterious process. A group of people enters a conference room with interview notes and stickies and emerges with recommendations for creating or changing the functionality or interface of a system.
For us humans, this is actually the most natural thing possible. We’re social creatures and pattern-recognition machines. Getting people together to analyze qualitative data is like throwing a party for our brains. Once you start, you’ll get hooked.
Champion Advertisement
Continue Reading…
And this is where design truly starts. You take all this messy data and begin to organize it, and group it, and label the groupings. Through conversation, clarity will start to emerge. Clarity in the data analysis will translate to clarity of concept, content relationships, navigation, and interactive behaviors. And best of all, if you work collaboratively that clarity and deep understanding will be shared.
Any models or maps you create will simply serve as documentation of what everyone already knows.
The process is actually pretty simple:
Closely review the notes.
Look for interesting behaviors, emotions, actions, and verbatim quotes.
Write what you observed on a sticky note, coding it to the source and the actual user, so you can trace it back.
Group the notes on the whiteboard.
Watch the patterns emerge.
Rearrange the notes as you continue to assess the patterns.
You will end up with a visual representation of your research that you can apply toward your design work in a few different ways.
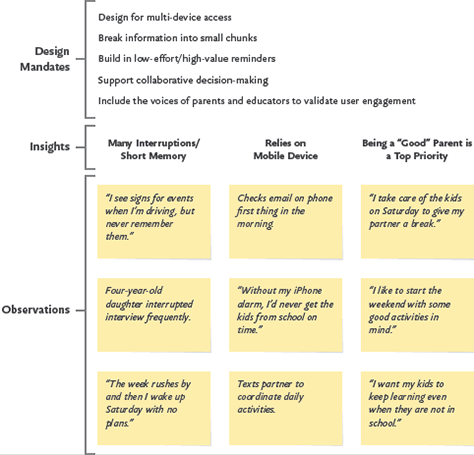
Affinity Diagram
Your first pass—and if you don’t have a lot of time, your only pass—should be to extract general design mandates from your interviews. Then you can prioritize those mandates based on business goals. This also requires the least diagramming skill.
The graphic shown in Figure 8.1 shows an affinity diagram starting to take shape.
The participants in the analysis build clusters of related observations. Once a cluster starts to take shape, you can extract the insights and the overarching mandate or recommendation.
The act of creating an affinity diagram will allow you to distill the patterns and useful insights from the many individual quotes and data points you gather through interviews and observation. If you work collaboratively with your team on identifying and documenting these patterns, the value of that research will be multiplied rather than lost in translation.
The diagram itself can be a handy visual reference or a tool for communicating with a larger team about your research and the principles you’ve uncovered.
An affinity diagram helps turn research into evidence-based recommendations.
Figure 8.1—An affinity diagram
Write Down Observations
As you review the notes or recordings, write down anything interesting you observed on a sticky note. An observation is a direct quote or objective description of what the user did or said. Pull out all of the particularly interesting quotes. Flag those that seem to represent the particular needs of each user type. These will be useful for your personas. Also note the vocabulary that participants used to describe their goals and the elements of the tasks or systems you are working with, particularly if they differ from those used in your organization.
Note all stated or implicit user goals. Implicit goals can be found in quotes or actions that indicate a particular desire. For example, starting the weekend with some good activities in mind. In particular, flag those you didn’t anticipate, but that your product might readily meet.
Example observations:
“I reset my password every time I visit the Web site because I never remember it.”
Participant’s four-year-old daughter interrupted three times during the thirty-minute interview.
“I take care of the kids for the whole day every Saturday to give my partner some alone time.”
Participant reports checking email on her phone every morning before getting out of bed.
Example goals:
“I like to start the weekend with some good activities in mind.”
“I want my kids to keep learning even when they’re not in school.”
Create Groups
Start grouping the notes on a whiteboard. You should start seeing patterns pretty quickly. Name the pattern and identify the user need that emerges from it, such as “Needs reminders for organized activities.”
“I see signs around town for events that look interesting, but I never remember before it’s too late.”
“The week rushes by and then I wake up on Saturday morning with no good ideas.”
Identify Next Steps
The final step of the analysis is to identify the actionable design mandate or principle.
When announcing a new exhibit, offer the ability to sign up for a reminder.
Allow members the option of digital access to all services—for example, online member newsletter instead of print, email guest passes to their friends.
Improve promotion of and navigation to activities and lesson plans.
Create a stronger voice for the museum based on the quality of its scholarship and expert status—for example, offer the museum perspective alongside the feed of technology news.
In addition to serving as a useful input to other tools, such as personas, and a nifty visual representation of your research and analysis, the affinity diagram helps you make decisions. You can decide which features and functionality to prioritize based on the patterns of needs you recognize. You can decide to do additional research based on the questions it raises. And it can serve as a common reference point for your team in discussing those decisions.
Creating Personas
…
Personas allow designers to advocate for users’ needs. Good personas might be the most useful and durable outcome of user research. Design, business strategy, marketing, and engineering can each benefit in their own way from a single set of personas. If you’re following an agile process, you can write your user stories based on a particular persona.
Personas exist to represent the user in user-centered design…. They embody the behavior patterns and priorities of real people and act as a reference point for decision-making. …
How many personas do you need? As few as possible, while representing all relevant behavior patterns. You can often reduce the number by creating relationships among them and assigning multiple roles to one persona. …
If you have interviewed some real people and worked collaboratively with your team to identify some patterns, you should be able to create some useful personas. …
Once you’ve created a set of personas, you can reuse them over time, even for different products.
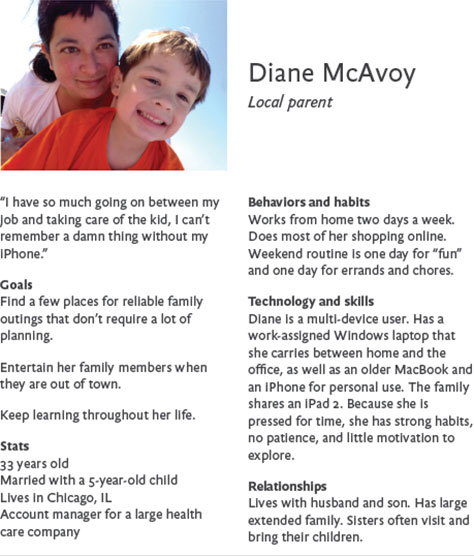
A persona document, such as that shown in Figure 8.2, should feel like the profile of a real individual while capturing the characteristics and behaviors most relevant to your design decisions.
Figure 8.2—A persona
Scenarios
If personas are your characters, scenarios are your plots. Each scenario is the story of how a persona interacts with your system to meet one or more of their goals. Running a persona through a scenario helps you think through your design from the user’s point of view. You can use scenarios at several points in your process:
To flesh out requirements.
To explore potential solutions.
To validate proposed solutions.
As the basics for a usability test script.
As long as a scenario hews closely to actual data gathered in user research, you have a lot of flexibility in the actual format. You can start from a specific answer to an interview question, such as “I wake up at 8 am on Saturday and read a local news Web site while the kids run around the house making noise.” While personas should remain reasonably constant in their characteristics and priorities, scenarios can evolve and deepen over time and change as your understanding of the system changes. Your personas are the Simpsons, your scenarios are the couch gag.
You can write a scenario as a short text narrative, a step-by-step flow, or even a set of comic panels—whatever is easy for your team to create and use to keep each persona represented in design and technology decision-making. If you find anyone on your team resenting the effort necessary to work with personas and scenarios, you’re doing it wrong. Simply drawing out scenarios on a whiteboard can work.
Scenarios are not themselves use cases or user stories, although they can influence each. A use case is a list of interactions between a system and a user, and is typically a way to capture functional requirements. Scenarios are from the perspective of the individual human user represented by the persona, not the perspective of the system or business process.
For example: Diane and her family just moved into the area. Her job as an account manager is very demanding during the week, but weekends are family time.
Goal—She wants to find local activities that will be entertaining for her son and relaxing for her and her husband.
Motivation—When she was driving home from the office on Friday evening, she saw banners for the Fantastic Science Center’s new exhibit on super storms. Sitting in her driveway, Diane Googles the science center on her iPhone.
Task—She needs to determine whether visiting the Fantastic Science Center will meet her needs. …
Mental Models
…
A mental model is an internal representation of something in the real world—the sum total of what a person believes about the situation or object at hand, how it functions, and how it’s organized. This representation is based on a combination of hearsay and accumulated experience. …
The closer an interface fits [a user’s mental model], the easier it will be to learn, use, and navigate. This is a concept with a lot of practical value.
You can use data from user research to diagram the composite mental model of each particular user type, and use that diagram to guide the design. …
There are two types of mental models: the type each of us holds in our head to help us deal with the world, and the type designers sketch out to better create that world. For maximum success, be aware of the former and get to work on the latter.
To design an application or a Web site, think about the mental models of the activities you want to support.
If you’re designing a mobile application to help commuters find the best way to get to work on public transit, it’s useful to look at the mental model of getting to work. If you’re redesigning buses, you’d want to look at the mental model of bus.
As a designer, you have your own mental model of what you’re designing, and you have a mental model of the users themselves, your set of assumptions about what they know and how they will interact with your design. It’s easy to overestimate how well your view matches their reality.
Documenting the user’s mental model allows you to not just get inside their head but get the inside of their head out of your head for everyone else to see. You can use a mental model diagram to collaborate with your team, prioritize features, better organize information, and identify areas where users have needs that aren’t being served.
A mental model diagram can help resolve issues that arise if different user types have widely divergent mental models, or if the actual design of the system is significantly different from the one that was originally proposed.
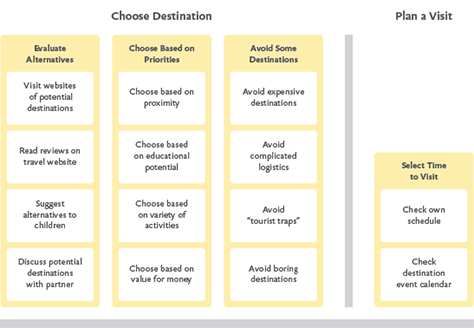
Mental model diagrams illustrate your users’ thought processes in detail, as shown in Figure 8.3. This information helps you identify relevant and necessary content and functionality.
Figure 8.3—Mental model diagram
How to Create a Mental Model
Do user research.
Make an affinity diagram. (See Figure 8.1.)
Place affinity clusters in stacks representing the user’s cognitive space to create the model. These groups will include actions, beliefs, and feelings.
Group the stacks around the tasks or goals they relate to. (See Figure 8.3.) …
Task Analysis/Workflow
Task analysis is simply breaking one particular task into the discrete steps required to accomplish it.
Contextual inquiry is the best prelude to task analysis, but you can also use data from user interviews as long as you’ve collected sufficient detailed information about how the participants work toward their goals step by step. Any given task has both cognitive and physical components that may be more or less important given the domain and the goal of the analysis. For example, making a complex purchase decision such as buying a new car typically has a series of cognitive activities surrounding identifying the need or desire for a car and conducting research online, as well as the physical component of actually going to the dealership and test-driving the car itself.
From Simple to Complex and Back Again
If you’re designing a site or application that addresses one or many complex tasks in helping users meet their goals, you can use task analysis. This method can be particularly helpful to map what people do in the real world to functionality you can offer on a site or in an application.
For example, purchasing tickets sounds simple, but the online process is often a complex and stressful multistep flow with a lot of decision points.
Task analysis can be helpful when designing any system intended to replace a real-world task with an online interface or changing the nature of the physical interaction as with the shift to mobile devices from desktop-based applications.
Break It Down
Using the information from user interviews or contextual inquiry, identify each step the participants reported or you observed them taking to complete a given task. Note the initial state, the event prompting the user to begin the task, the information or tools the user needs at each step, and any steps at which the task is likely to be interrupted or resumed. Put all of these steps back together as a workflow.
Receive postcard advertising fall event calendar.
Go to Web site.
Locate event information on homepage.
Click on link to see all available upcoming events.
Identify event.
Verify ticket availability and price.
Enter number of tickets desired.
Enter preferred delivery method.
Review information and total cost.
Select Buy Now.
Enter credit card information.
View confirmation page and instructions for receiving tickets.
Make It Flow
In addition to informing the feature set and flow of an application, task analysis will help you identify where specific content might support a user along their task path. Users might take very different paths than you anticipated, or be influenced by particular factors in the environment that you’ll need to consider in your designs.
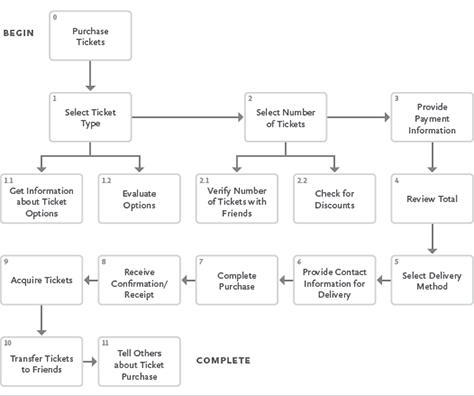
The task path for ticket purchase shown in Figure 8.5 can help identify areas where the user needs specific content and functionality to meet her goal.
Figure 8.5—Task path for ticket purchase
… The act of working together to synthesize individual observations will ensure that your team has a better shared understanding than a report could ever deliver.
Erika has worked in Web design and development since the late 20th century. In 2001, she co-founded Mule Design Studio where she leads the strategy consulting practice. Her enthusiasm for evidence-based decision making led her to write Just Enough Research. She presents to international audiences frequently on topics ranging from collaboration and design research to effective user-interface language. Currently, her talks explore the limits of using quantitative data to make design decisions. Read More
 Chapter 8: Analysis and Models