In my four-part series about gender and racial bias in artificial intelligence (AI) and how to combat such biases, Part 1 focused on the bias in voice- and facial-recognition software and the algorithms and big data that power them. Part 2 discussed how AI-based software—such as Google Search and some common design tools—influences designers in ways that can perpetuate biases in design deliverables. In Part 3, I provided a how-to guide for addressing your own implicit biases during the UX design process. Now, in Part 4, the final part of this series, I’ll describe how to make the case for anti-sexism and anti-racism in your UX design work.
Remember when we used to have to argue the return on investment (ROI) for User Experience to justify our existence and do all three parts of our job: the user research, the design, and the usability testing? Thankfully, times have changed, and most businesses have now accepted that good UX is good for businesses.
Champion Advertisement
Continue Reading…
But there are now other matters to consider: Does your product or service really work for everyone? Are you being as inclusive as you can and should be when designing for your target audiences? As the user advocate on your product teams, it’s up to you to represent all existing and potential users. Let’s look at some facts you should know when making the case for anti-sexism and anti-racism in your user research and design work.
Remember, You Are Not Your Users
Demographically speaking, if you’re reading this article, you’re probably white and are surrounded by other white people at work. While women have made some gains, joining the big technology companies at higher rates in the years 2014–2019 than in any previous period, minority hiring over the same five years has remained low. Bhaskar Chakravorti, in the Harvard Business Review, stated that the racial homogeneity of big tech is “a root cause of many larger issues that plague tech” such as the “devastating flaws in the industry’s own products.”
Take a good look around your own office and ask whether this is true of your workplace. I’m not asking you to storm your Human Resources department to demand gender and racial equity in hiring. As a solo UX professional, I’m certainly not in a position to lecture anyone about demanding diverse hiring practices or to ask you to support colleagues who might need an ally. But, as fellow UX researchers and designers, we all must advocate for diverse customer groups. Doing so can be challenging when white people make all the decisions.
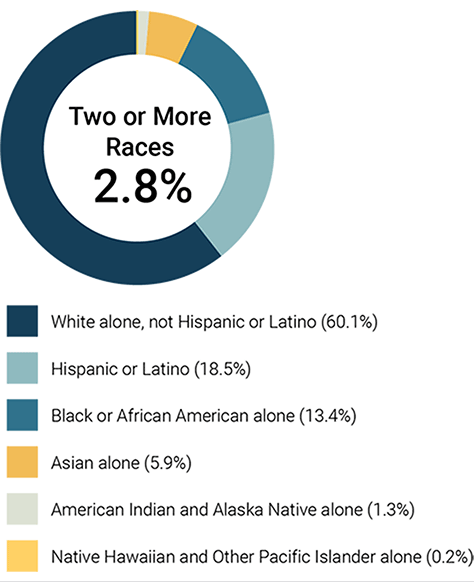
Figure 1—United States population by race in 2019
Note: These data from the United States Census Bureau, as of January 13, 2021, do not include 2020 census data.
Let’s consider some facts from the US Census QuickFacts for 2019. The next time you’re designing the latest, greatest, must-have app, remember that 17.3% of US households don’t subscribe to broadband Internet. The coveted target market of 24–34 year olds includes only 14% of Americans. Nearly 14% of Americans are foreign born. A fifth of households speak a language other than or in addition to English. About 5% of Americans self-identify as veterans. In 2019, over 28 million Americans under the age of 65 were living with disabilities, over 31 million Americans under the age of 65 had no health insurance, and over 34 million Americans were living in poverty. The last three data points have gone up since COVID-19 reached our shores.
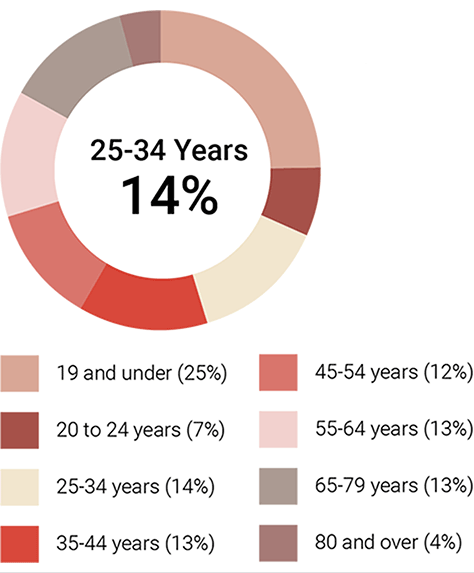
Figure 2—United States population by age in 2019
Note: These data from the United States Census Bureau, as of January 14, 2021, do not include 2020 census data.
As you can see in Figures 1 and 2, race and age in America are complex and will continue to be so when the 2020 census numbers come in. According to the Pew Research Center, the combined Hispanic and Latinx communities do not strongly identify with any specific racial or ethnic group, which makes counting them as a single group complicated. Also, it might not make sense to combine the Latinx and Hispanic communities. As Vox explains, “Latino and Hispanic identities aren’t the same. They’re also not racial groups.” There’s no Middle Eastern or North African category in the 2020 census—nor has there ever been in the past—which leaves many Americans without a racial-identity box to tick that might help us identify their distinct needs. Also, Asia is a really big continent. The idea that Filipino-Americans, Asian-Indian Americans, and Cambodian-Americans—three geographically far-flung groups from the 2020 census question on race—are all similar populations with the same needs is bonkers. Why does this matter? Because, as the US Census Bureau put it, the answers to these questions help us understand when and in what ways people are victims of discrimination. Understanding the historical discrimination against certain groups can go a long way toward stopping the spread of racial prejudice.
The Data You’re Relying on Are Probably Biased
As I discussed in Part 1, you should remind the powers that be that any big data driving your in-house software could be harboring pernicious discriminatory prejudices. If you’re designing software or apps for financial-services companies, this is especially true. In November 2019, MarketWatch revealed that the new Apple Card didn’t meet Apple’s expectations for customer experience. Goldman Sachs, the bank offering the card, had granted multiple Apple employees—all men, including the company’s co-founder Steve Wozniak—credit lines that were at least ten times higher than those for their wives. This happened even when the couples had joint bank accounts and shared other credit cards. One employee noted that his wife’s credit score was higher than his, but his credit line was 20 times higher than hers. Plus, the bank’s algorithm denied her application to increase her line of credit. Here’s the kicker: Goldman Sachs designed the software so humans could not intervene or correct the machine’s decisions. Talk about a poor user experience.
COVID-19 hit black-owned businesses harder than most last year. Forty-one percent of black-owned businesses have closed because of COVID-19, in comparison to 17% of white-owned businesses. There’s evidence to suggest that black-owned businesses received far fewer Paycheck Protection Program (PPP) loans than white-owned businesses. For example, in Wayne County, Michigan, home of Detroit, more than a third of all businesses are black-owned businesses and only 12.9% of businesses obtained PPP loans, in comparison to 18.9% nationwide. Across all of Michigan, about 29 black-owned restaurants received PPP loans, in comparison to 1,024 white-owned restaurants. Unfortunately, the PPP relies on business owners’ historic relationships with banks, and these connections are weaker among black Americans, who typically have low personal or family wealth, leading to lower access to loans and lines of credit. Mehrsa Baradaran, a law professor at the University of California, Irvine, said, “There is a structural flaw in [the PPP] program. It uses banks as middlemen. Any time you create a big program and give banks the ability to choose which customers it prioritizes, you’re going to have disparities. Credit disparities are where past injustices lead to present disparities.” Historical biases in big data and software algorithms at financial institutions lead to present and future biases. Because of these machines and their algorithms, banks that have denied black Americans loans in the past will continue to deny them loans in the future.
Racial and Ethnic Discrimination Is Costing Us
It is too soon to add up the total costs of lost tax revenue, lost consumer spending, and the increased unemployment claims that have resulted from denying these PPP loans. However, thanks to a recent study by Citigroup, some bigger-picture numbers are available. According to Citigroup’s math, discrimination against the African-American community has cost the US economy $16 trillion. Discriminatory lending policies against black business owners—and black Americans who wanted to start businesses, but couldn’t because banks denied them loans and lines of credit—cost the US economy 6.1 million jobs and $13 trillion. Even controversial financial whiz Jim Kramer would agree, that’s real money.
Black Americans face such biases beyond financial services as well. Just going to the mall has become a loaded event for many. A 2018 Gallup poll showed that nearly 30% of black Americans reported unfair treatment while shopping, in the 30 days prior to the survey: “That’s higher than the percentage of black Americans who reported recent mistreatment in dealings with police, at the workplace, in a health-care environment, or at a restaurant or other entertainment place during that same period.”
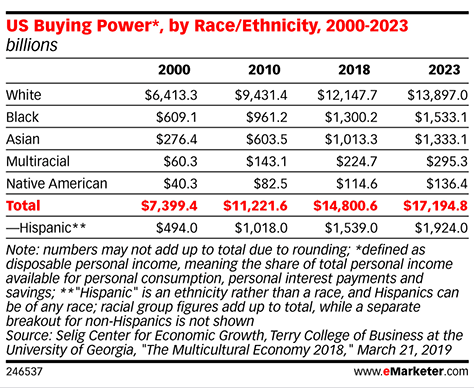
If you think your app isn’t replicating these racial-profiling biases in virtual shopping spaces, depending on what kinds of data you’re collecting, you might or might not be right. It’s worth finding out because black and Hispanic markets are outpacing white buying power, and they’ll continue to do so as the US population becomes increasingly younger and more racially diverse. It’s not clear exactly when the US might become majority non-white—either 2043 or 2045, depending on whose numbers are right—but it’s happening, according to projections by the Pew Research Center and PBS News Hour. Plus, it’s happening faster than people previously anticipated, according to the Brookings Institution.
Figure 3—US buying power by race and ethnicity, 2000–2023
While COVID-19 has devastated black families and business owners—and, hopefully, raised awareness about the plight of minorities in the US—outcomes for working women have resulted in headlines such as these: “Why the Pandemic Is Forcing Women Out of the Workforce” and the “Pandemic Will ‘Take Our Women 10 Years Back’ in the Workplace.” CNN reported that, during the pandemic, between February and November 2020, women lost more jobs than men—1.3 million more than men. Plus, in December 2020, women lost all of the jobs—156,000 of them—while men gained 16,000 jobs.
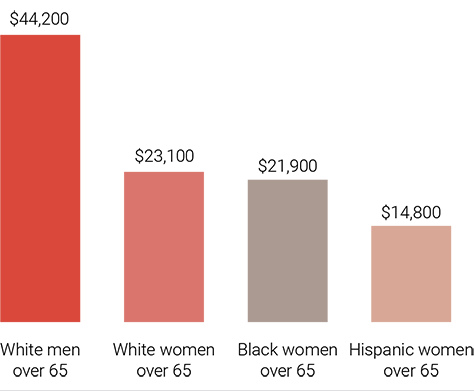
Before the virus sent so many working women home, women were already taking home less income than their male colleagues and received, at most, 4% of venture capital dollars. Plus, women-owned businesses received 31% less in loans. Women save 70% of what men save for retirement. White women over 65 make about half of what white men over 65 make. Latinx women over 65 make almost 40% less than white women and 67% less than white men. Because of their lower earnings, the average American woman collects only 80% of what the average man collects in social-security benefits. But women outlive men by about four years, which means they’re living longer on less money and, thus, are more likely to experience poverty in old age. Black, Hispanic, Native American, and LGBTQ women over 65 all experience “high rates of poverty due to historical discrimination.”
Figure 4—Average income for Americans over 65, by gender and race
In pre-pandemic 2019, women reported spending 160% more time on household chores and 180% more time providing physical care for family members—such as bathing kids and putting them to bed—than men did every day. If women were already doing nearly double the second-shift work, what happened when the pandemic made housekeeping and childcare their only shift? I can’t imagine what that translates to in COVID-19 hours per day. Having read the report “Man Is to Computer Programmer as Woman Is to Homemaker?” I worry that this algorithmic bias could become more entrenched in the machines than ever.
The irony is that women drive 70–80% of all consumer purchasing, spend more money per shopping trip, prepare 84% of family meals, make 90% of household healthcare decisions, spend over $200 billion on new cars and vehicle services annually, and make up 45% of video gamers. Meanwhile, 91% of women report that advertisers, including food marketers and automotive marketers, don’t understand them. Seventy-seven percent of women still take a man to the car dealership with them to avoid overpaying for a new or used automobile. As of 2015, fewer women ran S&P 1500 firms than men named John. Women both drive the American economy and are simultaneously being left behind by it.
I’ve been lucky over the past year: my four-year-old is going to school full time—actually going to school—and my teenagers are managing their hybrid learning. I am a healthy, white, mid-career, Gen-Xer, with a flexible freelance career, who is well-enough compensated to enjoy rather than stress over brief periods of underemployment. However, I still see myself in these statistics. I have a spouse, three kids, and a fur baby. All three human kids are man-children. Even the dog is a dude. Powering my family and our household requires a lot of planning, shopping, cooking, cleaning, and care. The laundry mountain makes me cry. Where is my Rosey the robot maid? Maybe if women-owned businesses and women entrepreneurs received better funding, I’d have a robot to do it all. Despite my better-than-average earnings, my husband makes three times my annual income in a good year. He also has twice the retirement savings I do and four times the personal wealth in investments and real-estate holdings. I do enjoy the benefits of his earnings—as long as we stay married, which could be touch-and-go these days because of middle-age, kids, pandemic, kids, laundry mountain, pandemic puppy, politics, the economy, and kids.
Conclusion
No matter how well any one of us is doing individually, these numbers add up to a very unhappy, unhealthy picture of the American economy if historic racial and gender biases continue to pervade our society and consumer decision making as they have in the past.
We should be investing in black-owned and racially diverse businesses. Companies with diverse management teams achieve nearly 20% higher earnings than businesses with below-average diversity scores. High-skilled immigration correlates directly to increased innovation and economic performance. According to Inc.com, fostering diversity in the workplace leads to increased creativity, innovative cultures, better understanding of consumers, richer brainstorming, and better decision making.
Companies with women in leadership positions outperform their peers. Firms with women CEOs have higher stock prices. Plus, women score higher than most men on leadership skills. According to the Pew Research Center, women are 34% better than men at working out compromises, 34% more likely to be honest and ethical, and 30% more likely to provide fair pay and benefits. In other parts of the world, women-led nations are doing a better job of containing the pandemic within their borders and achieving better economic recoveries than nations that men lead.
Anti-sexism and anti-racism are good for business, create opportunities, and open new markets. We must stop ignoring the needs of our diverse user groups. Women must stop ignoring their own needs! Now is not the time to bury our heads in the sand. It’s time to sort out the biases in our big data and algorithms—and our hiring and promotion practices—work through our unconscious biases, and embrace diverse consumer and user groups. We must drive this change from within and get our bosses to do the same. Let’s stop talking about creating good user experiences and start talking about User Experience for good. If we don’t, our competitors will. Then some other empathetic, anti-sexist, anti-racist UX designer would design a future in which all of us are equal in the eyes of the machines.
Sarah is Founder and UX Guru at Black Pepper, a digital studio that provides customer research, UX design, and usability consulting services. Sarah designs complex mobile and desktop Web apps for healthcare, financial services, not-for-profit organizations, and higher-education organizations. Her focus is on UX best practices, creating repeatable design patterns, and accessible design solutions that are based on data-driven user research. Sarah researches and writes about bias in artificial intelligence (AI)—harnessing big data and machine learning to improve the UX design process—and Shakespeare. Sarah teaches user-centered design and interaction design at the Brandeis University Rabb School of Graduate Professional Studies and Lesley University College of Art + Design. Read More