Want to turn statistics into stories? Data visualization is the answer. In this article, you’ll learn about the importance of data visualization and how to start using tables, graphs, maps, and more to communicate complex information in an entertaining, inspiring, and accessible format. Because visual resources tend to resonate highly with readers, this article also explores several opportunities for content creators, designers, and marketers to harness data visualization and visual content, boosting their Web site’s authority and driving traffic.
What Is Data Visualization?
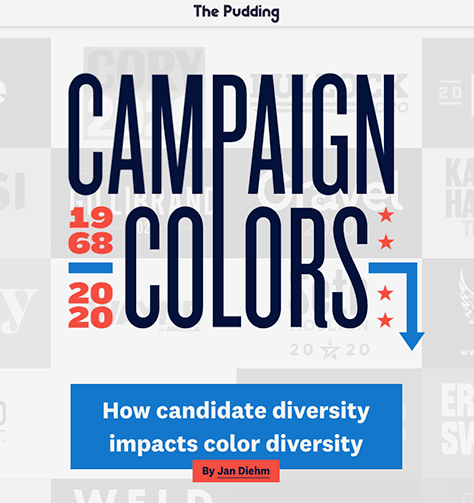
In today’s increasingly crowded digital-content landscape, the ability to digest massive amounts of information and present it effectively has never been more critical. As a result, data-visualization tools and technologies are having a moment. Audiences love their eye-catching aesthetics, while brands use data visualization to spot patterns quickly, predict trends, and turn data into insights. Figure 1 shows an example.
Champion Advertisement
Continue Reading…
Figure 1—Visualizing candidate diversity on The Pudding
But just what is data visualization? Essentially, it’s the graphic representation of data or information, which can take the form of scatter plots, line graphs, pie charts, bar charts, or heatmaps. You can use any of these visualizations alongside text to create infographics.
Benefits of Data Visualization
Data visualization adds value for users by making large amounts of information easy to understand. It can even improve knowledge absorption. A recent study found that humans can process visuals 60,000 times faster than text.
Because users tend to interact with content that they enjoy consuming, data visualization is an excellent way for brands to educate their audiences, establish authority, and create shareable assets. You only need to read the statistic that tweets with images are 94% more likely to be retweeted than text-only tweets to understand how valuable image-driven communications can be. Plus, social sharing is just one of the ways in which you can use data visualization to increase Web traffic. You can also build backlinks and optimize your content for search engines, helping users to find you.
Meanwhile, data visualization enables brands and marketing teams to make data-driven business decisions behind the scenes.
Different Types of Data Visualizations
Now, let’s consider several different types of data visualizations.
1. Infographics
Short for informational graphics, infographics vary in length and can contain multiple data visualizations, design elements such as icons and illustrations, and text. They need not be static, either. Animated infographics and infographic videos are popular ways of sharing information or telling a story.
2. Tables
One of the most stripped-back ways of presenting data, a table or spreadsheet lets the user make comparisons between categories. The categories typically populate the rows, while the points of contrast appear in the columns.
3. Bar Graphs
A bar graph can be helpful in comparing data across several different categories or groups or in tracking changes over a certain period of time. That’s because these graphs make it easy to see which groups’ numbers are the highest. Best practices include using consistent colors with bright accents to pull out meaningful data points or significant changes.
What's the difference between a chart and a graph? Many people use these terms interchangeably, but it’s worth remembering that a chart can take many different forms, and you can style data in many different ways. On the other hand, in a graph, data is plotted on a grid with axes that represent two variables.
4. Maps
You can use maps to present data by depicting geographical relationships.
5. Heatmaps
A heatmap charts qualitative information using various colors or degrees of saturation. Brands use them to understand consumer sentiment or in testing the user experiences of applications, Web sites, or online tools.
6. Scatter Graphs
Also known as a scattergram, scatter plot, or scatter chart, a scatter graph is a chart that usually depicts the relationship between two different variables or reveals distribution trends.
Creating Visual Content to Drive Traffic
I’ll now examine some of the main data-driven design trends that brands, digital news outlets, and creative agencies are using to attract attention.
1. Visual Storytelling
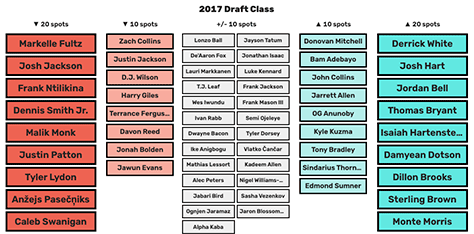
There’s an art to combining creative storytelling and technical analysis. The Pudding, a US-based digital publication, is expert at creating awesome stories, or essays, through data. Focusing on news headlines and pop culture, their team creates highly shareable visual content such as a scatter graph that explores hip-hop artists’ vocabularies or a range of charts investigating how the NBA drafts its players, shown in Figure 2.
This publication provides information and entertainment to audiences worldwide in a beautiful visual format. The Pudding is also an excellent platform for its sister company, the visualization studio Polygraph, resulting in a win-win for both users and the company. Loyal fans consume great content via its site, YouTube channel, and email newsletters, while The Pudding demonstrates its expertise to potential clients.
2. Interactive Content
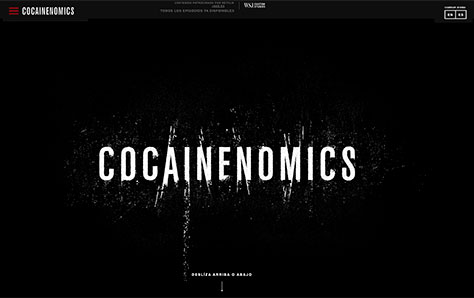
Brands can promote audience involvement through interactive content, inviting people to scroll, swipe, and click to reveal visual information. Figure 3 shows an example from the Wall Street Journal, which is sponsored by the Netflix series Narcos. It tells how Pablo Escobar rose from the barrios of Medellín to become the head of a $4 million US drug-running operation. Embedded videos, animated graphics, and pop-up pullquotes combine to create a dynamic timeline that immerses readers in the action.
Interactive content could include surveys and polls, quizzes, email messages, and calculators. Infographics that contain multiple visual elements lend themselves incredibly well to this format. An infographic that can drive people to a Web site should do the following:
Offer a solution to a particular problem—even if that problem isn’t something the user knows about just yet—for example, a gap in their knowledge of Colombia’s cartels.
Have an eye-catching design.
Be able to both educate and amuse the user.
Provide statistics and data that are backed up with source references to show credibility.
3. Gated Content
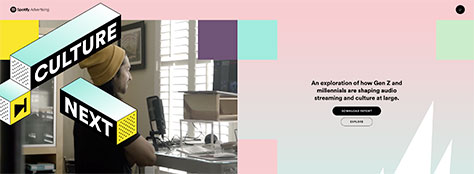
Content marketers often refer to gated content as hero content. Because it delivers so much value to its intended audience, there’s an opportunity to drive traffic to the Web site and capture some all-important data in return for access. In other words, users provide their email address or fill out a brief online form to view or download the content. Figure 4 shows a payoff for providing personal information.
Aimed at listeners, creators, and advertisers, the Culture Next report from Spotify is a great example. A dedicated landing page features animated graphics that provide a mini taster of the kinds of insights and visuals that the gated content contains.
By conveying the idea that the report contains insider knowledge that is based on data that is usually unavailable to regular people, the brand builds potential readers’ curiosity and creates a feeling of FOMO (Fear of Missing Out). Their request is that users provide their name, company, and work email address so they can view the report.
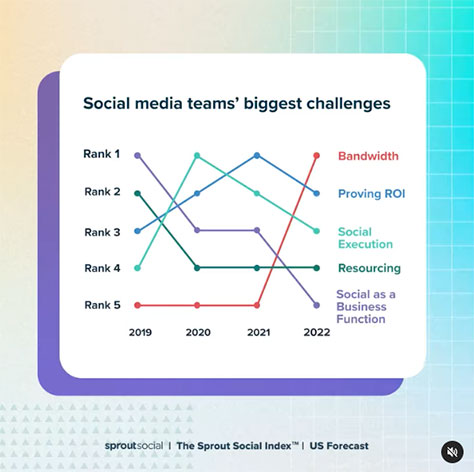
4. Made-for-Social Infographics
Long infographics might make for great reading, but no one would want to share them as a series of screenshots. That’s what makes exploring made-for-social infographics worthwhile. These are short, snappy sound bytes that distill head-turning pieces of information into standalone social assets like that shown in Figure 5.
Because made-for-social infographics are custom made, they follow the technical specifications of the platform on which they will appear—whether that’s Facebook, Instagram, or LinkedIn—and, thus, provide a great user experience.
Animated, made-for-social data visualizations from Sprout Social offer insights into the data they’ve gathered during their annual survey of consumers and social marketers, capturing their audience’s attention and raising people’s awareness of the report.
Made-for-social infographics are also a great way of making your long-form content work harder and go further—reaching new audiences and driving more traffic to your Web site in the process.
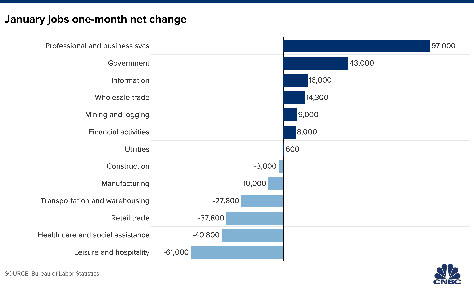
5. Supporting Graphics
Data visualization doesn’t have to mean cutting down on copy. In the case of the news outlet CNBC, their supporting graphics complement articles, provide extra context, and get an article’s main points across in an approachable and straightforward format, as shown in Figure 6.
The article is broken into easy-to-read chunks for the audience, and the supporting graphics add interest. For the publisher, there’s the opportunity to keep people on the page longer as they view the bar graphs.
When creating supporting graphics, remember that their aim is to complement the surrounding material, not clash with it. That means sticking to the publication or brand’s visual identity when you’re selecting a color palette, fonts, and an overall look and feel.
Getting Started with Data Visualization
Optimizing information design through the use of visual assets can drive traffic to your Web site. Whether you’re a designer, a marketer, or a brand owner, follow best practices when embracing the various types of visual content and you can start reaping the benefits of data visualization.
Note—Data visualization is a topic that Envato frequently publishes content about on our educational publication Envato Tuts+.
A freelance writer, Helen an author for the Envato Blog. She has a passion for charting the latest food and drink, travel, technology, and design trends. Living in London provides plenty of opportunities for new experiences, so she’s never short on inspiration. Read More