A common frustration among UX professionals who are employed in the software development industry is the perception that executive-level management gives lip service to user experience rather than supporting specific UX activities by allocating sufficient resources for them.
This perception is seldom a reality. Competent management does realize that the user experience is critical to the long-term health of their company. Unfortunately, when developing software, the temptation to steal from the feature-list cookie jar and try to squeeze just one more feature into the current development cycle by skipping UX work is simply too great for most Product Managers. This strategy, however nearsighted, can and often does make money in the short term by achieving a temporary increase in sales. The only way to win resources in this situation is to bring the discussion back to dollars.
This article tells you how to build a quick-and-dirty UX cost-benefits compass that directly ties persona efficiency to dollars. You can use this compass to focus UX efforts on specific activities that provide the greatest benefit, as well as justify increasing UX activities in general. It is often possible to construct a working UX cost-benefits compass by assembling existing data, and it’s easier than you might expect.
Champion Advertisement
Continue Reading…
In this article, I’ll present a case study that explores the use of a UX cost-benefits compass in the development of a product called the Customer Portal (CP), which allows organizations to proactively manage customer inquiries by leveraging Web self-service. The CP is Customer Relationship Management (CRM) software that is distributed under the Software-As-A-Service (SAAS) delivery model and replaced an existing system my company, RightNow Technologies, designed about ten years ago.
The following steps outline a general approach to constructing a compass. These steps can work for many business models and industries—though you may need to modify the steps to construct an accurate compass for your organization.
Step 1: Focus on a single product.
My company delivers a single solution that actually includes over two dozen separate products. Rather than trying to boil the ocean and justify UX work to benefit all users of the entire solution, we focused on just one product—the Customer Portal. I recommend you focus on a specific product or project to work on first, because building on small successes is a reliable way of generating larger successes.
Step 2: Understand the persona ecosystem.
A product almost always has more than one type of user, or persona. A UX cost-benefits compass is most effective when you apply it to products employees use within an organization, but you can also apply it to products that have a more diverse audience.
We constructed our persona ecosystem during an earlier phase of the project and were able to reuse it for this analysis. Five personas use the Customer Portal, each of whom has a distinct role:
user—A current or potential user.
content owner—A customer-support employee who responds to inquiries and composes pieces of content for the Customer Portal.
developer—A software engineer who is responsible for the back-end Web programming that supports the CP.
designer—A graphic designer who is responsible for creating helpful graphics, diagrams, and other visual materials displayed in the CP.
administrator—A member of the IT or Operations staff who is responsible for configuring the system to support the other personas.
If it is early enough in the planning phases of a project, you might not yet have had—or might not get—an opportunity to construct personas. However, it may be possible to construct draft or provisional personas in the interim that are based on existing data. For those of you in an organization with a more traditional engineering focus, you can use user classes in place of personas. While there are some significant differences between user classes and personas, both will work for the purposes of this analysis.
Step 3: Estimate the relative proportion of each persona.
Proportions may vary for companies of differing sizes. One way to estimate ratios is to pick a small customer, a medium-sized customer, and a large customer, then estimate the relative proportions of the personas for each of them. These three numbers will help give you a ballpark idea of the distribution. If the numbers indicate a skewed distribution, you may need to adjust the estimates later on in Step 8.
Table 1—Number of users for each persona
Persona
Company A (Median)
Users (Sessions)
708,891
Content Owners
300
Developers
10
Designers
3
Administrator
1
Note—My company constructed this table using information captured during persona interviews and augmented with Internet session data for users of the legacy system that our Service Delivery (Web Hosting) group provided.
Step 4: Estimate usage.
Each persona probably will not work full time with the product, but instead will spend only a portion of his or her time using the system. Persona interview data may suffice for estimating usage rates, though it is often useful to conduct an additional interview with a subject-matter expert (SME) to verify or adjust these estimates.
Table 2—Usage estimates per user
User Persona
Hours per Year
One User (One Session)
.0333 (2 minutes)
One Content Owner
40
One Developer
360
One Designer
120
One Administrator
960
In the Customer Portal, the time spent using the system varies by persona. We captured session time per user by examining the server logs in the existing system. (Note—There may be multiple sessions per person. We cannot track individuals, so instead rely on user sessions.)
It is generally quite difficult to pin down exact numbers for individuals belonging to a given persona. When in doubt, involve an additional SME to corroborate them.
Step 5: Determine persona salary data.
The best source for salary information is occupational salary data that is freely available on the Web. For personas for whom salary doesn’t make sense, it may be possible to use the national median income.
Table 3—Persona salary data
Persona
Job Title
Salary
Wage per Hour
User
N/A*
48,000*
$23.08
Content Owner
Customer Service Representative
30,794**
$14.80
Developer
Web Developer
69,074**
$33.21
Designer
Graphic Designer
43,829**
$21.07
Administrator
Systems Administrator
42,131**
$20.26
* US Median Income
** Salary.com data
Step 6: Estimate the total number of users.
If your company licenses its product by workstation, this is as simple as counting the total number of licenses. For a site-licensed product, you can calculate the total number of users by taking the results from Step 3, then multiplying them by the total number of customers.
Table 4—Total users per persona
Persona
Number of Users (Across 1350 customers)
User
956,986,070
Content Owner
405,000
Developer
13,500
Designer
4,050
Administrator
1,350
We sell site licenses for the Customer Portal, so we calculated the total number of users by taking the result from Step 3.
Step 7: Get out your calculator.
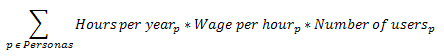
You now have all of the information you need to build your UX cost-benefits compass! The formula for the annual recurring cost for your customers to use your product is as follows:
Using this equation, for each persona in your set of personas, you would first multiply the persona’s hours per year by wage per hour and by the number of users corresponding to that persona, then add the resulting costs for all of the personas to get the total cost. The table below shows the calculations for the Customer Portal.
Table 5—Total cost
Persona
Hours per Year
Wage per Hour
Number of Users
Persona Cost
User
.0333
$23.08
956,986,070
735.5 Million
Content Owner
40
$14.80
405,000
239.8 Million
Developer
360
$33.21
13,500
161.4 Million
Designer
120
$21.07
4,050
10.2 Million
Administrator
960
$20.26
1,350
26.2 Million
Total Cost: 1.16 Billion
Note the relative cost for each persona: It will cost customers 23 times more to employ content owners than it will to employ designers. One could argue that, for every week of UX work you spend on activities that benefit content owners, you should spend a little less than two hours on UX work that benefits designers. Designers and administrators are both in support roles, so we should be concerned only that they can achieve their goals—not that they can do so with exceptional efficiency.
Even though customers are not themselves paying users of the CP, this persona drives the development of the entire system. When users cannot find the information they need by using Web self-service, they often make costly support calls instead. The high cost of live telephone operators is the single largest reason that customers leverage Web self-service and purchase the CP.
For every 1% increase in efficiency we can achieve for the content owner and developer, our customers will save roughly 4 million dollars. Even though this is only about $3,000 per year for each of our 1,350 customers, it still demonstrates the significant net benefit that UX work can deliver.
Step 8: Look for inconsistencies in the data.
Occasionally, after finishing the preceding steps, some piece of data will appear to be in conflict or disconnected from other pieces of data. As a general rule, you can revise estimated data if your harder data suggests it. You must obviously do this sparingly or else you would risk tainting the entire analysis. The goal here is to remove outliers without disturbing too many data points.
Our experience tells us that Step 4, usage estimation, is the most difficult to do accurately. Often these estimates have a high degree of variance from company to company and even within the same company. The idea behind Step 8 is to try to land within the correct order of magnitude for yearly usage time—Is it tens of hours or hundreds of hours?—rather than attempting to pinpoint time with artificial precision.
Conclusion
While a UX cost-benefits compass lacks complete scientific rigor, having some information is immeasurably better than having no information. Without a clear business direction for UX work, it is simply too tempting for Product Management to drift back into stealing cookies from the feature-list cookie jar. A UX cost-benefits compass can help your organization to get its bearing and point its efforts in the right direction.
If others in your organization question the validity of your analysis, offer to revise the input data, but not your method! Very rarely will the input data change the estimate’s order of magnitude, and you’ll gain buy-in from individuals through listening and responding to their questions. This can often turn resistance into momentum behind the UX cause.
We have explored only the benefits side of the UX cost-benefits compass. Once your organization understands the magnitude of UX benefits, it is a matter of judgment to decide through which specific UX activities you can achieve the desired level of benefit.
Efficiency of use and recurring annual labor costs account for only a fraction of the potential for leveraging cost-benefits justification methods to justify UX work. If you are interested in diving deeper or would like to attempt a more ambitious analysis, I recommend you obtain a copy of the seminal work, Cost-Justifying Usability, by Bias and Mayhew.
I love it when I come across more unique and simple methods of quantifying the value of a product’s user experience. Great work. I have included this article in this week’s Weekend Reading from The Product Guy.
With a background in Human-Computer Interaction, Ben cares deeply about designing simple, usable solutions to business problems. His areas of expertise include customer self-service, voice of the customer, multi-channel interactions, customer care, case management, and business agility. Ben holds an MS in Human-Computer Interaction and is a board-certified Associate Human Factors Professional. Read More