When we think of analytics, we think of marketing campaigns and funnel optimization. Analytics can seem a little overwhelming, with so many charts and lots of new features. How can we use analytics for design insights?
The best thing about analytics is that they can show us what people do on their own. The worst thing is that analytics don’t tell us much about context, motivations, and intent. Like any kind of data, there are limitations. But that doesn’t mean analytics aren’t useful. Working with analytics is about knowing where to look and learning which questions you can reasonably ask.
Champion Advertisement
Continue Reading…
Google Analytics makes a great starting point for learning about how people are using your Web site. Plus, it’s familiar to many people on your product team, so it can be a good way to begin conversations about the user experience.
In this column, I’ll go over a few ways to get started with analytics—with an eye toward user experience. This information is by no means exhaustive and does not cover setting up events, goals, or custom reports. I’ll refer you to Avinash Kaushik’s blog, Occam’s Razor, and Annie Cushing’s blog, Annielytics, for that. Instead, we’ll look at the basics that can help anyone get an initial read on analytics.
Getting Started with Analytics
With Google Analytics, it makes sense to formulate questions first, because there is so much data to explore. However, I usually start by looking at three big-picture views first.
In-Page Analytics
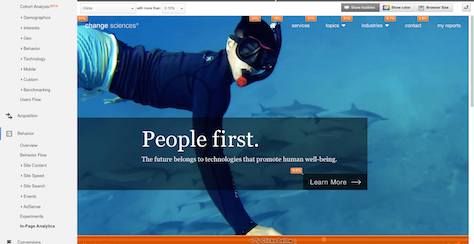
To get started, I head straight to the Behavior menu, where I first look at In-Page Analytics. Here you can see your Web site with an overlay showing what percentage of people have clicked particular links, as shown in orange in Figure 1. You are seeing the data in the context of the design, which makes the data compelling and easy to understand.
Figure 1—In-Page Analytics
As soon as I look at a page, I can get a sense of what is getting attention and what isn’t. (However, if you have multiple links to the same place on a page, you’ll have to set up events to differentiate them.) I can click the page to follow where people clicked next, but that can take a lot of time, so it’s easier to see paths using other methods.
Behavior Flows
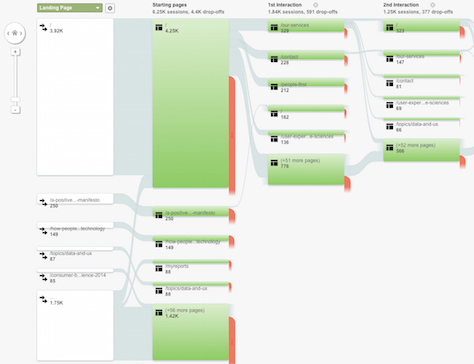
This brings us to Behavior Flow, shown in Figure 2, which illustrates the paths people take on a site. It shows you what people do and, more importantly, what they are not doing. How do people come to key pages? What do they explore next? What are they missing? From this view, you can see what happens before and after each step and where people get off track, and you can identify unexpected steps.
Figure 2—Behavior Flow
Site Content
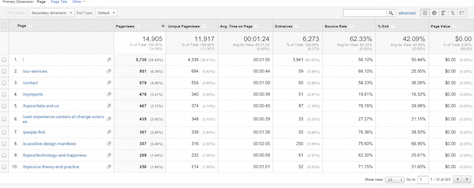
All of these questions lead you to the third thing you should look at, Site Content, which is also under Behavior and is shown in Figure 3. I look at everything here, but am especially interested in Landing Pages and Exit Pages.
Figure 3—Site Content
Answering Questions About the User Experience
Now that you have an overview of what people are doing on the site, it is time to focus on the data that is relevant to the questions you have. Here are just a few examples.
Understanding Expectations
You want to know what people expect, and a lot of those expectations come from what they have just seen. Looking at Referrals, which is under Acquisition, will get you started. Looking at the actual pages that link to your site will give you a better understanding of how they may be framing the experience that people will have on your site.
You will also want to look at Social, under Acquisition. Trackbacks can also give you some sense of how others are framing your experience. Users Flow can show you whether there are differences between those people coming in through social channels—and conversations, really—and other people who come to your site.
Understanding expectations from organic search can also be helpful. Knowing how people are finding your site also gives you a bit of information about what they might expect, so take a look under Organic Search in Channels, too.
Finally, Bounce Rates, or the percentage of people who visited just one page on your site before leaving, can indicate a potential mismatch with visitor expectations. Like anything you find with analytics, understanding why requires further investigation.
Informing a Customer Journey
Alongside all the other research and ideation you are doing to understand customer journeys, it’s good to take a look at analytics, too. Behavior Flow is a good starting point, as is User Flows, which is under Audience. Much of what you looked at to understand visitor’s expectations will be relevant for this goal, too.
In most organizations, someone—maybe you!—has already set up funnels. It can be helpful to compare the actual flows against the ideal funnel to see where they diverge. I’d recommend setting up goals for micro-conversations like reading a page—using time and page depth—or other user actions like downloading or watching a video. This can help you identify meaningful moments in the experience.
Looking under Audience at Technology and Mobile can indicate priorities for supporting for your user base and provides a way to track adoption of new features.
Gauging Interest
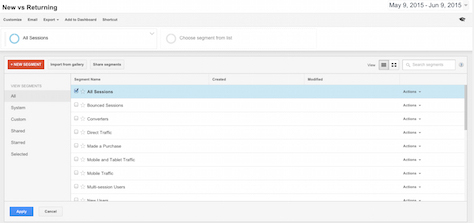
The overview for Audience will give you a snapshot of which content and features on the site generate the most or least interest. This includes metrics like unique visitors, pageviews, and time on site. Average time on page can show whether a certain page is underperforming in comparison to the site average, too. Many of the other options under Audience, like Demographics and Interests, require custom setup. However, it’s worthwhile to look at Behaviors under this menu to compare New & Returning Visitors. You can also add new segments, by what people saw or what they did. This Add Segment option is at the top of many of the views, plus there are many ready-made options, as shown in Figure 4.
Figure 4—Adding a segment
Checking Navigation
Looking at Site Search, under Behaviors, will give you a good idea of what people may be having trouble finding. Of course, we know that some people just default to search, or it may be that they happened to notice search first. Even so, this information can be helpful. Then, to follow up, compare the ratio of site searches to navigation clicks.
Next Steps with Analytics
These are just a few of the ways in which you can use analytics to understand people and your site. Analytics can help us to identify problems for further exploration, follow up on our assumptions, and confirm or debunk research findings. In combination with other data sources and research methods, analytics can give us another perspective on our designs in the wild.
I agree that UX design should be informed by analytics. Google Analytics is a great place to start for Web analytics. However, in mobile applications, user behaviour is very different to the Web—users are interacting with your mobile app in various ways. They might be swiping, pinching, zooming or tapping particular points on the screen, or tilting or shaking the device. To understand your mobile users’ behaviours, you need a mobile-specific analytics solution. That’s why we have developed App Analytics, a comprehensive tool for all your mobile analytics needs. It has all the classic event-based analytics, like events and funnels, but also unique features such as heat maps, gesture recognition, crash and exception analytics, and push notification analytics.
Pamela is founder of Change Sciences, a UX research and strategy firm for Fortune 500s, startups, and other smart companies. She’s got credentials—an MS in Information Science from the University of Michigan—and has worked with lots of big brands, including Ally, Corcoran, Digitas, eMusic, NBC Universal, McGarry Bowen, PNC, Prudential, VEVO, Verizon, and Wiley. Plus, Pamela has UX street cred: She’s logged thousands of hours in the field, trying to better understand how people use technology, and has run hundreds of UX studies on almost every type of site or application you could imagine. When she’s not talking to strangers about their experiences online or sifting through messy data looking for patterns, she’s busy writing and speaking about how to create better user experiences using data of all shapes and sizes. Read More