In actuality, most people spend most of their time on Web sites and apps other than those our organizations have created, and we may not know much about what those experiences are really like. However, your organization can map the customer journey. There is no one right way to map a customer journey. Journey mapping can mean defining an ideal path that we’d like customers to take. Sometimes it means seeking a more nuanced understanding of what people do on a Web site. Less often, we look at an experience globally, mapping touch points for a product or brand, both online and offline.
Whether people are making direct comparisons or just moving from site to site, the most common user experience is the multi-site experience. Booking travel typically involves more than ten sites. Finding a place to eat might involve a mix of sites and apps, very few of which are about the actual dining experience. Even watching a favorite TV show—something we used to think of as a fully engaged or directed activity—can involve other sites.
Champion Advertisement
Continue Reading…
Thinking about what data you need to inform the customer journey, there are clear gaps. You have a lot more data about your Web site or app than about the other sites and apps that may make up part of the experience, or the user experience ecosystem. Even though your organization may not have data on hand about that experience, it’s not as difficult to learn about as you might think.
I’m not going to cover all the research you might do to map a customer journey. Rather, my goal is to talk about how you can use easily accessible data to understand the broader experience. Using data to inform a customer journey requires following these steps:
Defining the ecosystem, or the other types of sites that are part of the journey.
Identifying the sites that come before and after your site in the journey.
Learning more about the customer journey, including the experiences on those sites, from the data you have on hand.
1. Defining the Ecosystem
Most organizations devote a lot of attention to their competitors—sometimes to the point of unhealthy obsession. Teams make lists of the features they see on their direct competitors’ sites and apps. They may focus on one design-forward site or management’s favorite. Sometimes they even devote a few minutes to a competitors’ site and app during a usability test.
Obviously, considering competitors is important for a lot of reasons—even when mapping the customer journey. People do actively compare things, and while they may be moving from one direct competitor to another to compare costs, rates, terms, or options, they are also drawing comparisons of the sites themselves.
Comparisons can frame the experience, but people may not compare explicitly, and they may not remember that much detail. Recent research on memory and the experience of Web sites and apps shows that people remember beginnings because that is where they go frequently. An app’s icon or a landing page on a site leaves an imprint.
When it comes to technology, people also remember peak experiences—when they found an amazing deal or discovered something new. Endings seem to be less of a factor in the online experience, and often, they are not clearly defined. One site quickly leads to another and another, and all of them are related in the person’s mind—around a question, a goal, or just their curiosity about a topic.
All of this certainly makes a case for your learning about the customer journey, on which your site or app is mixed up with others, in all sorts of ways. However, it also means that you shouldn’t obsess over every detail, but instead, focus on the details relating to starting points and peaks.
The Anchor and the Landmark
It’s likely that another Web site or app is framing the experience of your site or app, whether people are aware of it or not. If you look at what frames that experience, it is usually one of two types of sites. I call them the anchor and the landmark. The site or app that people use first—or that they remember from a recent or frequent experience—sets their expectations for everything about the experience.
An anchor is a site or app that is upstream from your site or app—that is, it’s the site or app that the user visited just before yours. Since the user has just been on that site or app, it may be setting expectations for your site. The user may still have its nomenclature, navigation categories, and layout in mind. The anchor may also influence how the user makes decisions on your site. Decisions are often influenced by the order in which you present options, according to behavioral economists. (A good place to find out more about choice architecture is Nudge.)
The anchor may not be a direct competitor, which is why it might not have been on your radar when you were working out your experience strategy. Understanding how that upstream site or app is framing the experience for your site or app may be critical to your improving its experience. This anchor effect can be positive or negative, so it’s definitely worth exploring.
The landmark is a site or app that is familiar enough to users for them to remember it, at least a little, even when it is has been a while since they used it. The more people are exposed to a site or app, the more it shapes how they perceive other sites. For example, when someone is booking a flight, they are likely to have a rough picture of Expedia or Kayak in mind, even when they are not using those sites. When people encounter a new site or app, they invariably think about others that they use all the time.
The landmarks are the sites and apps that shape conventions. They are so familiar that they have really become part of the mental model people have about a particular type of experience. In Change Sciences dataset, we see that people often prefer familiar sites—sometimes over sites that seem to be more beautifully designed. People usually see landmarks in a positive way, regardless of whether the experience is delightful.
The Next Stop
Downstream sites or apps can inform you about users’ next steps—or perhaps what might be missing from users’ experience of your site or app. A site or app might be a next stop that continues the experience on your site. Users may have a pre-planned route or follow a typical circuit—for example, first visiting one site to find ideas for places to go, the next for reviews, the next to find and compare flights, and the next to book a flight. A downstream site could point out an opportunity or a gap in the experience on your site.
Now that you know about these three types of sites or apps that are important to the overall experience people have online, you can start to identify them. There are several data sources that can help you to identify and learn about anchors, landmarks, and next stops.
2. Identifying the Other Sites in the Journey
In my last column, I looked at some ways to use analytics to understand people’s behaviors on a site. In Google Analytics, you can use Behavior Flow or User Flows to understand how people move through your site. You can set up Funnels, which typically represent an idealized customer journey, and compare that journey with the actual paths people take. From there, you will want to look at more specialized analytics in Chartbeat or Clicktale, if you have them. Or you may want to do more research. Or you might rely on both analytics and research.
Using analytics to understand people’s behaviors and paths on your site or app can go a long way toward defining a customer journey. It can also provide a reality check on work you have already done. However, analytics are also a great starting point for defining an ecosystem. They tell you where people come from just before visiting your site or app and where they go next.
Finding Upstream Sites
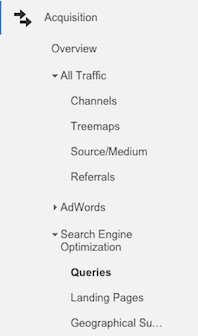
In Google Analytics, look under Acquisition to find upstream sites or apps. This will tell you something about where people were just before visiting your site or app. While you’ll see Campaigns and Social there, looking at All Traffic > Source/Medium, shown in Figure 1, is more helpful to understanding the customer journey because it lets you see where people were right before they visited your site or app. You should also look at Search Engine Optimization > Queries to see what keywords people are using. This can give you some sense of what words they have in mind when they come to your site, and that may help you to understand and set expectations.
Figure 1—Google Analytics’ Acquisition menu
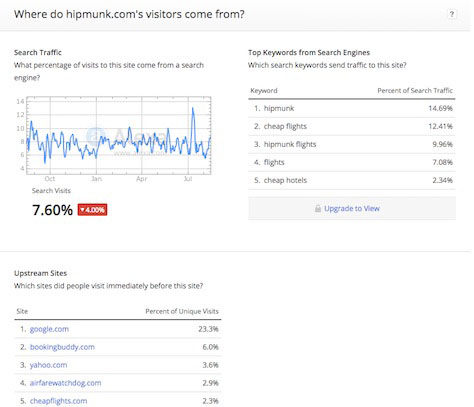
Besides using Google Analytics, there are other options for finding out where people start. Alexa is my favorite site for finding out where people start. Compete provides some of the same information, but much less without a subscription. On Alexa, you can search for your site, then look at upstream sites and keywords to see where a good number of people were just before visiting your site. Let’s take travel as our example. As shown in Figure 2, I searched for Hipmunk.com on Alexa, then looked at upstream sites and keywords.
Figure 2—Hipmunk on Alexa
Next, you can look at each of the upstream sites on Alexa, then work your way backward from each of them to a couple more sites. While you probably won’t be able to find the starting point for your customer journey, you can certainly start to see patterns and relationships.
In our example, we can see what other travel sites are in the mix. From keywords for the sites, we can see that inexpensive is key. Moving backward through the chain, by looking at bookingbuddy.com and cheapflights.com, we see that smartertravel.com and trivago.com come up, too. You should look at each of those sites to understand people’s expectations. If you look at the big, online travel agencies (OTAs) on Alexa such as Expedia and Priceline, you will see that people are more often coming from other big OTAs.
While you’ll get no definitive answers, doing this would certainly give your team some new information about customers and their customer journeys to consider. By understanding the anchors, you can better understand the expectations people have when coming to your site or app.
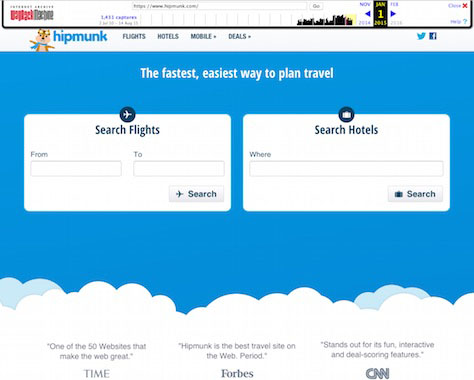
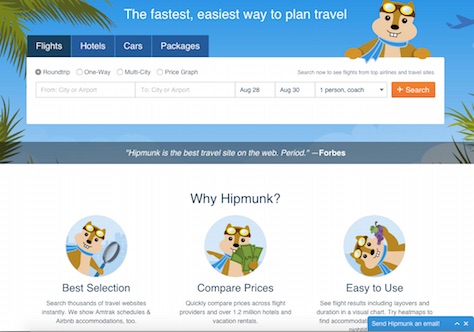
One site that can help you to understand landmarks—that is, the sites that set conventions—is the Internet Archive’s Wayback Machine. You can see how sites have evolved over time. Looking at our example site, hipmunk.com, we can see that the site is evolving to align with the landmark sites in how they present search on the home page. Figures 3 and 4 let you compare screenshots of the hipmunk home page from January and August 2015.
Figure 3—Hipmunk.com circa January 2015 Figure 4—Hipmunk circa August 2015
Finding Downstream Sites
In Google Analytics, Behavior Flow shows you common paths, but it also shows you where people drop off your site. To find out where people go next, you will have to set up event tracking. This might mean making friends with your analytics team, but they likely already have this set up. If doing this beyond what is reasonable for you to take on, there are other sources for finding out this information. The data won’t be quite as granular, but it will help you round out the customer journey.
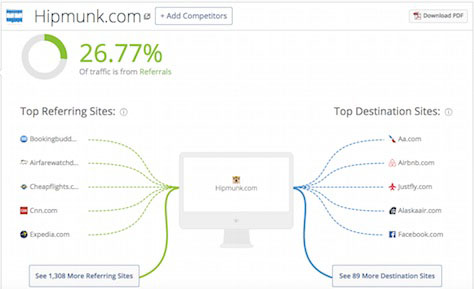
SimilarWeb is a great source of information about other sites in a customer journey and can provide information about downstream sites without event tracking. The visual flow shown in Figure 5 makes it easy to see movement between sites, again using Hipmunk.com as our example.
Figure 5—Upstream and downstream sites for Hipmunk.com on SimilarWeb
We’ve already learned a lot about the other sites that are relevant to our example customer journey. Now, let’s look at social-listening tools to learn a bit about the experience people are having on those sites. Doing this won’t give you a complete picture, but it will likely give you some new questions on which to do further research.
3. Learning About the Customer Journey
For me, social listening provides a bridge between analytics and user research. If you are looking to bring more data into your customer-journey mapping, social-listening tools can give you a little more detail about what is important in the experience that people are having on your site, as well as on the other sites that you have identified as being part of the bigger picture.
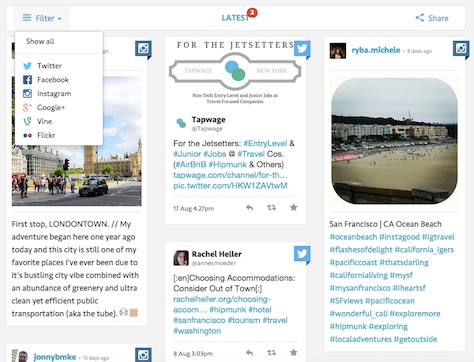
If you have a tool like Sprout Social or Brandwatch available in house, that’s great. But there are a lot of other, freely available tools that can get you started. Tagboard, shown in Figure 6, is a great place to start because it gives you a quick visual on what people are saying about your site or app across social-media sites. It also makes it really easy to see related hashtags.
Figure 6—Search results on Tagboard
Topsy and Social Mention are real-time search tools for social channels that provide sentiment analysis. Most of the time, I don’t find sentiment scores that useful because they tend to be somewhere in the middle. So, I focus less on the numbers and more on the content of the posts. Even so, these sites can help you to filter through posts and identify trends.
Conclusion
The experiences people have with other sites and apps can drive them to your site or app, frame the questions they have, shape their expectations for category names or navigation items, and more. Using alternative data sources to learn about the customer journey—especially the other sites that people encounter along the way—can help teams to validate their decisions and explore questions for which they need answers.
How is your team using data to inform the customer journey?
This is great from an analytical viewpoint if you feel statistics and figures are enough to shape a customer journey. However, for best practise, I feel behavioural research with users in context, accompanied by real tasks and understanding their whys is more powerful. It’s the complete picture combining both. I would not make a major business decision on a customer experience that’s based on stats and Google Analytics alone.
Pamela is founder of Change Sciences, a UX research and strategy firm for Fortune 500s, startups, and other smart companies. She’s got credentials—an MS in Information Science from the University of Michigan—and has worked with lots of big brands, including Ally, Corcoran, Digitas, eMusic, NBC Universal, McGarry Bowen, PNC, Prudential, VEVO, Verizon, and Wiley. Plus, Pamela has UX street cred: She’s logged thousands of hours in the field, trying to better understand how people use technology, and has run hundreds of UX studies on almost every type of site or application you could imagine. When she’s not talking to strangers about their experiences online or sifting through messy data looking for patterns, she’s busy writing and speaking about how to create better user experiences using data of all shapes and sizes. Read More