UX researchers and other project stakeholders often fervently debate the number of participants that are necessary for usability studies. At the core of this debate is often the tension between the usability professional’s desire for the best possible study and the business team's desire to reduce time and expense.
In 2009, Ritch wrote an article for the Journal of Usability Studies titled “How to Specify the Participant Group Size for Usability Studies: A Practitioner’s Guide” to address this issue. He based his article on a wide survey of the literature then available, and his intent was to help usability professionals make clear recommendations for the size of participant groups in particular contexts, as well as to understand the basis for those recommendations and their associated risks.
Champion Advertisement
Continue Reading…
Recently, because of usability professionals’ continuing interest, we decided to revisit this issue and reviewed more contemporary literature. We’ve written this article to summarize the key conclusions from Ritch’s earlier article, which remain relevant today.
Fundamental Issues with Usability Studies
There has been much research into usability studies. Often, the goal has been to determine a single optimal number of participants for a study. However, two key flaws characterize much of this research, as follows:
These studies often use quite advanced statistical methods that are unfamiliar to many usability professionals. Therefore, their validity can be difficult to assess.
Their focus is almost exclusively on problem discovery, which is not always the primary objective of usability testing.
The result of these flaws is that many usability professionals accept this research as a guide, without understanding the associated rationale, context, reasoning, and risks.
The Use of Statistics in Usability Studies
Ritch’s earlier article argued that usability professionals should not advocate for “studies that have maximum reliability, whatever the cost.” Instead, we should work with other stakeholders to create a realistic study design that is optimal for the project as a whole.
When quoting statistics, we must be careful to consider the margin of error for any findings. For example, there is more to Jakob Nielsen’s oft-quoted statement, “Five participants will discover over 80% of the problems” than study teams often present. This particular statistic has a 95% confidence level and margin of error of ±18.5%, which means there is a 95% chance that a group of five participants will find between 66.5% and 100% of the problems. While some groups of five in Nielsen’s study did find nearly all of the problems, one group found only 55% of the problems. Therefore, we cannot assume that five participants are sufficient for every usability-testing situation. If there are just five participants, the results may not tell the whole story.
We must also question the validity of the statistical methods that produced these numbers. In reality, statistical methods are not free of either opinion or bias because they rely on assumptions of some type. This means we could draw different conclusions from the same research data if we used different statistical methods. Remember the saying “There are lies, damned lies, and then there are statistics”?
Studies for Problem Discovery
Two important issues for problem-discovery studies are that it can be hard both to define a problem and rank the importance of discovered problems. According to D.A. Caulton, problems are often a factor of the interaction between a user and the product, not necessarily a static feature of a user interface. Not only might a specific problem exist for just some participants, a specific problem might exist for just a single participant on one day, but not on another day. Therefore, it can be very difficult to agree on what actually constitutes a problem. Plus, the ranking of problems is highly subjective.
When setting up a usability study, you need to consider the probable mean percentage and what minimal level of problem discovery is necessary—in other words, the average percentage of problems you hope to find, as well as the minimum percentage. As Table 1 shows, going from 5 to 10 participants greatly increases the expected level of problem discovery, but going from 15 to 20 participants has far less impact. These numbers are very important to understand. We can have fewer participants in a study if undiscovered problems would have a small impact on users, but we must have more participants if the stakes are high—for example, in life- or enterprise-critical situations. We can also have fewer participants if there will be opportunities to find important problems during a later round of testing.
Table 1—Numbers of problems found relative to number of participants
Number of Participants
Minimum % Found
Mean % Found
5
55
85.55
10
82
94.686
15
90
97.050
20
95
98.4
30
97
99.0
40
98
99.6
50
98
100
From Faulkner, 2003
Another important consideration is the complexity of the study itself. Nielsen is often criticized for citing research from simple studies with well-defined tasks. Clearly, the more complicated the tasks, the more complex the study should be, and the more participants may be necessary. In such a case, it is also necessary to consider training issues. If the entire target user population will receive exactly the same training, this effectively reduces the study complexity, so you can use fewer participants.
Studies to evaluate a prototype of a novel user-interface design often concern the discovery of severe show-stopper problems. Testing usually reveals such severe errors relatively quickly, so these tests often require fewer participants.
So, contrary to popular thinking, there is no one-size-fits-all solution for problem-discovery studies. Context and complexity have a big impact on the appropriate number of participants necessary for such a study. This reality is probably a factor in the diversity of widely cited advice. For example, both Virzi and Perfetti and Landesman found that the appropriate number of participants for many studies ranges between three and twenty. Nielsen’s statement that five participants are enough was clearly based on simple studies, and he has more recently stated that the number of participants must increase with the complexity and criticality of a study. Faulkner argued that ten participants would probably find a minimum of 82% of problems. Turner believes seven participants may be ideal, even for complex studies.
In summary, research suggests that from three to twenty participants can provide valid results, and a good baseline is between five and ten participants. In general, there should be more participants for more complex, highly critical projects; while fewer participants are necessary when testing more novel designs.
Comparative Studies
Usability professionals often run A/B tests, which involve testing two designs against each other to determine which is better. Often, new design B is tested against the currently implemented design A. In other words, an A/B test is a hypothesis test—that is, a team hypothesizes that interface B will work better than interface A, so runs a test to determine whether that is true.
Comparative studies generally use usability metrics such as task-completion rate and time on task. These metrics are highly objective, so usability professionals often want to present statistically significant results from such studies. These results can be compelling, but they have some common pitfalls.
To reject the null hypothesis, we must be reasonably sure that different groups of participants and the target audience are equally skillful—that is, that design B did not have a better result because group B was significantly more skillful. This can be difficult to determine, so is a reason for caution when quoting such results.
It’s also important to remember that, even though a finding may be statistically significant, it might not be meaningful. For example, if you tested a new user interface with 100 participants and found they were able to complete a task 2% faster, the result would be statistically significant, but not necessarily meaningful enough to act upon.
One approach to comparative studies is to make them open ended, incrementing the number of participants in a group until one of the following occurs:
The resulting data becomes significant.
It becomes apparent that there will be no significant finding, despite testing with additional participants.
You cannot continue the study because of time or budget constraints.
While open-ended comparative studies may be practical in academia, this is not typically a useful approach in the commercial world, where we need to set time and budget constraints for studies. Another approach is to test with very large participant groups, which is likely to produce statistically significant results—assuming that is possible. However, such tests are often too expensive and time consuming for commercial contexts.
These problems have led many usability professionals to guesstimate the appropriate participant-group size for comparative studies. The Common Industry Format (CIF) for Usability Test Reports advises a minimum of eight participants. This fits with advice from Nielsen and Landauer that we’re unlikely to get statistically significant findings from groups of less than eight participants, but quite likely to get them with groups of 25 participants. Spyridakis and Fisher found that groups of ten to twelve often provide statistically significant results.
Punctuated Studies
Another approach that Ritch advocates is to perform usability studies in stages. For example, during the first stage, you might test with five participants, and the primary intent of the testing would be to catch any show-stoppers. You’d schedule additional stages of testing, each with five participants, with the intent of generating statistically significant results. If, at any stage, you catch show-stoppers or produce statistically significant results, you can terminate the study early and allocate your time and financial resources elsewhere. This iterative approach, though uncommon, is often optimal and fits well with the philosophy of user-centered design and agile approaches. However, it can be harder to predict the time and money your study would require, which can make things difficult from a management angle.
Summary
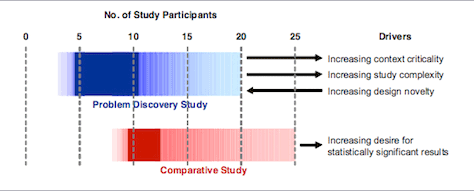
There is no one-size-fits-all solution for determining the optimal number of participants for a usability study. Rather, we should think more in terms of ranges like those shown in Figure 1. Problem-discovery studies, which are subjective in nature, typically require between three and twenty participants, with five to ten being a good baseline. Generally, the number of participants should increase with study complexity and product criticality, but decrease with design novelty.
Figure 1—Numbers of study participants for problem-discovery and comparative studies
From Macefield, 2009
For comparative studies—which are typically more objective than problem-discovery studies because of their heavy reliance on metrics—group sizes of between eight and 25 participants typically provide valid results, with ten to twelve being a good baseline. Generally, group size should increase if you want statistically significant results; punctuated studies can be an efficient way of achieving this goal.
Whatever the number of participants you use for a particular study, you should always understand the assumptions, limitations, and risks that are associated with your decision.
References
Caulton, D.A. “Relaxing the Homogeneity Assumption in Usability Testing.” Behaviour & Information Technology, Vol. 20, 2001.
National Institute of Standards and Technology. “Project: Usability Standards.” National Institute of Standards and Technology, 2015. Retrieved October 1, 2015.
Faulkner, L. “Beyond the Five-User Assumption: Benefits of Increased Sample Sizes in Usability Testing.” Behavior Research Methods, Instruments, and Computers, Vol. 35, No. 3, 2003.
Landauer, Thomas K. “Research Methods in Human-Computer Interaction.” In Handbook of Human-Computer Interaction, ed. Martin G. Helander. Amsterdam: North Holland, 1988.
Nielsen, Jakob, and Thomas K. Landauer. “A Mathematical Model of the Finding of Usability Problems.” Proceedings of ACM INTERCHI, 1993.
Perfetti, Christine, and Lori Landesman. “Eight Is Not Enough.” UIE, June 18, 2001. Retrieved October 1, 2015.
Spyridakis, J. H., and J. R. Fisher. “Usability Testing in Technical Communication: The Application of True Experimental Designs.” Technical Communication, Part 4, 1992.
Turner, Carl W., James R. Lewis, and Jakob Nielsen. “Determining Usability Test Sample Size.” In International Encyclopedia of Ergonomics and Human Factors, 2nd Ed., Vol. 3, ed. W. Karwowski. Boca Raton, FL: CRC Press, 2006.
Virzi, R. A. “Refining the Test Phase of Usability Evaluation: How Many Subjects Is Enough?” Human Factors, Vol. 34, 1992.
You’ve missed a crucial point: It’s not what you find out in usability testing that matters, it’s what you do about what you find.
Every time a team decides, “We can’t test with that many participants, so we won’t do any testing at all,” that’s a major failure.
Every time a team decides, “Let’s just start testing with a few participants and see what we find,” that’s a major success. It’s really quite easy to run a decent usability test, and they’ll learn far more than they expected.
Every time a team decides, “Let’s get a proper user-research program going with regular usability tests as part of it and use what we find as a key driver for our work,” they’ve got it right! Totally! And discovered the real joy and value of user research—without worrying about numbers at all.
Author completely missed the paper of Borsci et al. 2013, reviewing and extending the five user assumptions published by transactions of CHI. It is a big lack in the reference list and in the text. To me the paper was a brilliant example of how you can handle the sample size.
You’d schedule additional stages of testing, each with five participants, with the intent of generating statistically significant results. If, at any stage, you catch show-stoppers or produce statistically significant results, you can terminate the study early and allocate your time and financial resources elsewhere.
There is a problem with this approach, as described in this post. The more times you look at something, the more likely you’ll see something “statistically significant” by chance. Please don’t abuse statistics like this.
For comparative studies, I wouldn’t recommend using less than 20 participants per condition. I would also be careful about adding participants until a result becomes significant, because this greatly increases the likelihood of getting a significant result due to pure chance. These insights (PDF) come from experimental psychology, but I believe they should apply here as well.
It’s also important to remember that, even though a finding may be statistically significant, it might not be meaningful. For example, if you tested a new user interface with 100 participants and found they were able to complete a task 2% faster, the result would be statistically significant, but not necessarily meaningful enough to act upon.
I performed an A/B test and found exactly this—that test B had faster task completion times and less errors, but using a combination of SUS and a post-test Likert scale, I determined that the "perception"—that is, satisfaction—of the test was more important to gauge the efficacy of the test design.
I find this a very strange comment as the approach is no different statistically to using a larger sample size. I think the writer has missed the point or does not understand statistics. The article certainly does not abuse statistics!
I’m afraid neither of these assertions is factually correct. I got the idea of punctuated studies from an internationally famous professor of psychology!
Dr. Janet M. Six helps companies design easier-to-use products within their financial, time, and technical constraints. For her research in information visualization, Janet was awarded the University of Texas at Dallas Jonsson School of Engineering Computer Science Dissertation of the Year Award. She was also awarded the prestigious IEEE Dallas Section 2003 Outstanding Young Engineer Award. Her work has appeared in the Journal of Graph Algorithms and Applications and the Kluwer International Series in Engineering and Computer Science. The proceedings of conferences on Graph Drawing, Information Visualization, and Algorithm Engineering and Experiments have also included the results of her research. Read More
Ritch has worked in UX design since 1995. He has a BA with Honours in Creative Design, an MSc with Distinction in IT-Computing, and a PhD in Human-Computer Interaction (HCI) from Loughborough University’s HUSAT (HUman Sciences and Advanced Technology) Institute. Ritch has lectured at the Masters level in five countries—on user-centered design, UX design, usability engineering, IT strategy, business analysis, and IT development methodology. He also has numerous internationally recognized qualifications in IT-related training and education. He has published many HCI articles and was on the editorial team for the Encyclopedia of HCI (2007). Ritch has led major UX design and user-centered design projects at Bank of America, Vodafone, Thomson-Reuters, and Dell Computers. His international experience spans 15 countries. Ritch presently heads Ax-Stream, an approved Axure training partner. His work currently encompasses Axure training, advanced Axure prototyping, usability and acceptability testing of early conceptual prototypes, coaching and mentoring of senior UX designers, and strategic UX work—integrating UX design and user-centered design into agile development methods and moving organizations from second and third generation to fourth generation prototyping methods. Read More