Many well-known technologists have embraced the potential of augmented reality (AR). According to Tim Cook, Apple CEO, “We’re already seeing things that will transform the way you work, play, connect, and learn. Put simply, we believe AR is going to change the way we use technology forever.” Although an AR future sounds promising, the question remains: What real problems have we actually solved using AR? While people are chasing an augmented Pikachu around the globe, could AR disrupt an entire industry?
As UX professionals at an AR startup, our focus was on leveraging technology to create more efficient methods of performing enterprise-related tasks. One such task was the lean assembly of complex products. Could the use of AR measurably improve this process? As our workforce ages, could AR play a vital role in the transfer of knowledge from experienced workers to novices? Finally, is it possible that this emerging technology could eliminate entry-level workers’ production errors? We attempted to answer these questions by conducting an experiment. Our objective was to gather quantifiable data to investigate whether AR work instructions on a head-mounted display (HMD) would improve key usability metrics. In comparison to standard, paper-based, exploded-view work instructions, could AR improve the assembly of an automotive alternator in a lean assembly environment?
Champion Advertisement
Continue Reading…
Our Research Method
To answer these questions, our team initially focused on defining metrics for our research. After much discussion, we decided to use the traditional ANSI and ISO categories: efficiency, effectiveness, and user’s self-reported satisfaction—even though AR is a new technology. We felt that these metrics would still be most effective in comparing the usability of AR to paper-based, exploded-view work instructions. Our experiment design consisted of two phases of in-lab usability testing, with two groups of twelve participants, as follows:
During Phase 1, the first group of participants used paper-based, exploded-view work instructions with minimal text in assembling an automotive alternator.
During Phase 2, the second group of participants used AR work instructions on an HMD in assembling the same alternator.
During each participant session, we recorded qualitative and quantitative performance metrics, including the following:
efficiency, or time on task
effectiveness, or task-completion rate and task-error rate
user-reported satisfaction
Our participant-recruiting criteria for novice workers included junior and entry-level assembly workers with two years or less of field-work experience. Data from the Bureau of Labor Statistics helped us to identify job titles such as Lean Assembly Workers, Field-Service Workers, Maintenance Engineers, and Repair Workers. Participants were male, multi-ethnic, and between eighteen and thirty years old.
Data Analysis
Another significant decision for our team focused on the best manner of analyzing and reporting the usability metrics we collected. To simplify data analysis for our stakeholders, we chose the Single Usability Metric (SUM) psychometric tool, which is a standardized, summated, single usability metric that was developed to represent variations in four common usability metrics: task-completion rates, task time, user satisfaction, and error counts. The SUM is generated by weighting each of these metrics equally and averaging them. The SUM metric doesn’t replace the individual metrics—it simply summarizes and condenses them—similar to the way a mean summarizes a large set of numbers. The theoretical foundation of SUM is a CHI 2005 paper, “A Method to Standardize Usability Metrics into a Single Score,” by Sauro and Kindlund. When establishing success metrics for this study, we decided to compare the overall SUM, as well as the individual metrics we used to generate it, for both groups.
Phase 1: Analog Work Instructions
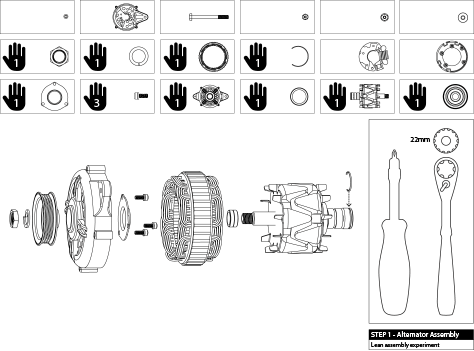
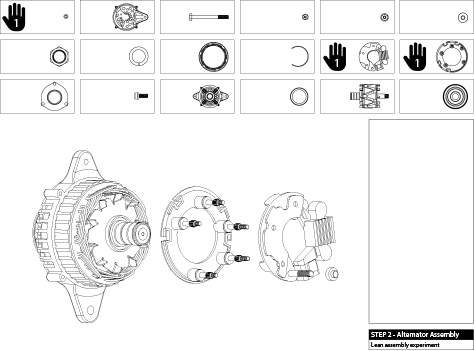
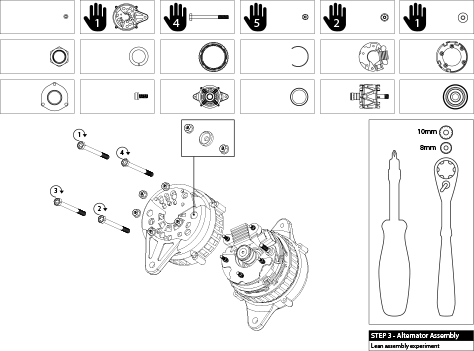
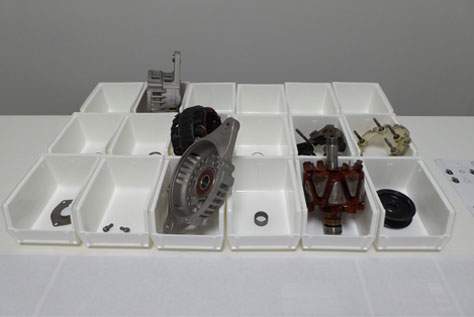
Establishing a baseline for the research was an important part of our experiment design. In investigating lean assembly processes, we found that lean assembly workers typically receive simple, exploded-view, paper diagrams to support their manufacturing operations. During Phase I of our research, we divided the alternator assembly into a three-step process, as shown in Figures 1–3. This allowed our team to observe and record participant’s benchmark metrics. For each step, we identified specific parts for participants to select from bins in the work area, as shown in Figure 4. The detailed exploded-view diagrams showed how the selected parts fit together and what tools to use in assembling them.
Figure 1—Step 1 Figure 2—Step 2 Figure 3—Step 3 Figure 4—Bins of alternator parts in the work area
In addition to the SUM usability metrics, we observed and noted participants’ behaviors, perceptions, attitudes, and motivations. These data points revealed consistent user frustrations and impediments while simultaneously serving as the basis for the design of the Phase 2 AR work instructions.
The most revealing participant behaviors centered around confusion. When participants became confused, they began to ignore the analog work instructions altogether. They would then pick up the alternator, look at it closely, and continue to assemble and disassemble parts. When we questioned participants about their behavior, many said they were relying on their gut-level feel and accumulated personal experiences in completing the assembly. They often noted that they listened for auditory cues such as clicks, snaps, and other sounds to reassure them that the assembly process was proceeding correctly.
Participant confusion, frustration, and large numbers of errors typically indicated the painpoints that we observed during Phase 1 of the lean assembly process. These often occurred because the 2D, exploded-view work instructions did not adequately compensate for the complexity of assembly, unclear assembly sequences, and difficult part alignments.
In general, participants exhibited a high degree of overconfidence before attempting to complete each step. Our team initially referred to this bias as The Dude Factor, which we observed repeatedly when young males attempted to accomplish unfamiliar tasks. Their unjustified self-assurance often persisted even after they had made several errors in completing a step. This bias, which is actually called the Dunning-Kruger effect, is characteristic of the behavior of relatively unskilled individuals who suffer from illusory superiority, mistakenly assessing their ability to be much higher than is accurate. It is attributed to the metacognitive inability of the unskilled worker to accurately evaluate their own ability level. In real-world, lean-assembly situations, this bias is especially troubling. Often, overconfident workers who make mistakes do not self-correct or ask for help, thus contributing to the delivery of faulty products.
Establishing Success Metrics
Data analysis of the metrics we gathered during Phase 1, for the twelve participants using analog work instructions, helped us to establish our success metrics for the AR work instructions. We based our success criteria primarily on the degree to which our team believed the AR work instructions could mitigate the participant painpoints and problematic attitudes and behaviors we identified during Phase 1. Our success metrics, or key performance indicators (KPIs), were as follows:
Increase the overall SUM for the AR work instructions by 10% in comparison to the analog work instructions.
Decrease the average error rate for the AR work instructions by 20% in comparison to the analog work instructions.
Increase the average completion rate for the AR work instructions by 10% in comparison to the analog work instructions.
Decrease the average time on task for the AR work instructions by 10% in comparison to the analog work instructions.
Increase the average satisfaction with the AR work instructions by 20% in comparison to the analog work instructions.
Iterative Design of the AR Work Instructions
To meet these KPIs, we established a repeatable, three-step assembly process, as follows:
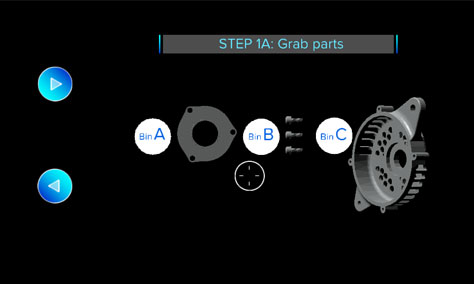
The AR instructions identified parts for the participant to select from lettered bins in the work area, as shown in Figure 5. The bins and the work area were identical to those from the first phase of the study.
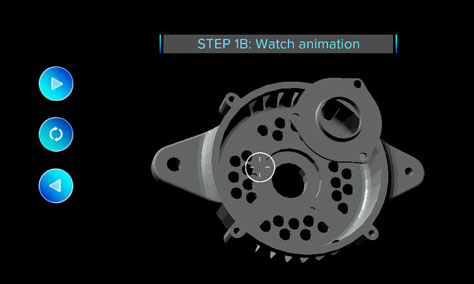
An animation showed how the selected parts fit together, as shown in Figure 6.
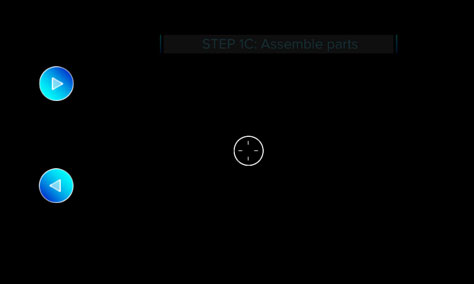
The HMD’s field of view cleared to let the participant continue the assembly with an unimpeded view, as shown in Figure 7.
Figure 5—Parts to choose from lettered bins Figure 6—Animation shows how to assemble selected parts Figure 7—Participant’s view clears
This process repeated over the same three steps as in the paper work instructions until the participant successfully built the alternator. Our hypothesis was simple: Efficient, step-by-step, AR work instructions would achieve the defined success metrics by mitigating the participant painpoints and problematic attitudes and behaviors that we identified during the first phase of the study.
We used an iterative design methodology to evolve and test the AR work instructions that appeared on the HMD. We conducted guerrilla usability testing sessions with a mixture of internal employees and participants from our target audience to progressively identify and mitigate the application’s painpoints. We broke complicated tasks down into simple sequences, providing close-up views of critical steps. Voiceovers provided additional hints and warnings. We used each participant’s feedback to modify the design before beginning another testing session with a different participant. This iterative process continued until we had minimized errors and maximized step completions and user satisfaction.
Phase 2: AR Work Instructions
During Phase 2, a different group of twelve participants attempted to assemble the same alternator, using the same three-step process. However, instead of using paper-based, exploded-view work instructions, participants used AR work instructions that appeared on an HMD. Participants who methodically followed the step-by-step, AR instructions had a minimal number of errors. Those who were less methodical or less inclined to follow the step-by-step instructions made more errors, became confused, or took longer to complete each step. The Dude Factor reared its head once again! Overconfident participants often relied on their intuition rather than the step-by-step audio directions and animations. Usually, they based their intuition on prior automotive or other related experiences. An unexpected benefit of the step-by-step AR instructions was that they aided participants in self-correcting errors.
At the conclusion of Phase 2, the quantifiable progress we had made in comparison to Phase 1 was encouraging to our team. The Phase 2 AR work instructions largely mitigated most of the painpoints we had identified during the first phase of the study. Specific areas of improvement included:
complicated assembly sequences
tricky parts alignment
common assembly mistakes
participants’ overall reluctance to read directions
Just as important, the AR work instructions also seemed to compensate for the overconfidence factor that was present in most participants. Breaking complex tasks into simpler microtasks enabled overconfident users to correctly assemble the alternator. It also helped them to self-correct mistakes by allowing participants to replay assembly sequences and warning them of common mistakes.
Success Metrics: Analog Versus AR Work Instructions
Our team compared the metrics for the two types of assembly instructions to determine the success of the AR work instructions. These success metrics included the Single Usability Metric (SUM), error rates, completion rates, time on task, and user satisfaction.
Single Usability Metric
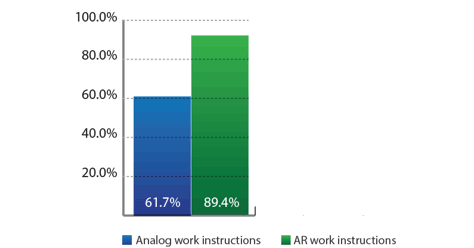
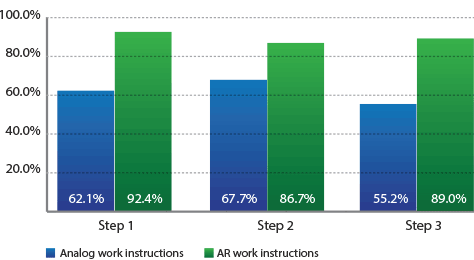
For the AR work instructions, the overall SUM increased by over 27% in comparison to the paper-based instructions, as shown in Figure 8. Our goal was a 10% increase. Figure 9 shows the SUM for each of the three steps.
Figure 8—Overall SUM Figure 9—SUMs for individual steps
Error Rate
The average error rate for participants using the AR work instructions also exceeded our success criteria. The error rate actually decreased by approximately 93%, while our goal was a 20% decrease.
Completion Rate
The average completion rate increased by 100%. Our goal was a more modest 10% increase. Just 50% of participants were able to complete each of the three steps using the paper-based work instructions, while all twelve participants—that is, 100%—were able to complete each of the three steps using the AR work instructions.
Time on Task
The only metric relating to the AR instructions that did not show an improvement relative to the analog work instructions was time on task. Our goal was to decrease the average task time by 10%. However, the average task time for participants using the AR work instructions actually increased by 17%. There were a number of reasons for this increase. First, in comparison to the nonlinear, paper-based work instructions, the step-by-step AR work instructions took longer to view. Second, participants often replayed the AR assembly animations if they were unsure of an assembly step. Finally, half of the twelve participants using the paper-based work instructions voluntarily abandoned some portion of the three-step assembly process. All twelve participants using the AR work instructions completed the entire three-step assembly process. Therefore, step abandonment may have contributed to a shorter average task time for the paper-based instructions.
Satisfaction
Our final success metric was participant satisfaction. TheAR work instructions increased average satisfaction by over 38%, while our goal was just a 20% increase.
Our Conclusions
After the completion of our study, we reviewed our original list of questions regarding the potential of AR work instructions. Let’s review what we learned.
Could AR Measurably Improve the Process of Lean Assembly Workers?
The data from our study suggests that viewing AR work instructions on an HMD can significantly improve key usability metrics in a lean assembly environment, in comparison to paper-based, exploded-view work instructions. AR work instructions significantly reduced errors and increased both task-completion rates and user satisfaction—although task-completion times increased.
Could AR Eliminate Production Errors by Entry-Level Workers?
Our study’s results indicate that the twelve participants using AR work instructions averaged less than one error during their first-time assembly of an automotive alternator. In addition, a number of significant use cases emerged, demonstrating the ability of AR work instructions to mitigate certain types of errors. These use cases include the following:
sequencing—Cases where parts must be assembled in a specific order.
alignment—Cases where the alignment of two or more parts being assembled is complex.
mistake warnings—Cases where users need to receive warnings to prevent common mistakes during a specific assembly sequence.
troubleshooting—Cases where users need to be shown how to troubleshoot a common mistake.
reluctance to read instructions—Cases where many participants commented that they didn’t want to read the instructions and preferred the animated instructions and voiceovers of the AR work instructions.
user overconfidence—Cases where displaying step-by-step instructions that warn users about common mistakes and providing animated demonstrations that enable self-correction could mitigate errors due to overconfidence.
Could AR Play a Vital Role in Knowledge Transfer from Experienced to Novice Workers?
As our workforce ages, it is vital that experienced workers transfer their knowledge to novice workers. The effectiveness of the step-by-step AR work instructions suggests the usefulness of AR in training novice workers. The advantages of AR as a teaching tool include the following:
AR is useful for demonstrating complicated part-assembly sequences with step-by-step animation, which is more effective than a two-dimensional diagram printed on a piece of paper. AR enhances learning because the user can view every step of the assembly process. This is especially the case when the animation features a realistic, three-dimensional model.
AR animations allow novice workers to repeatedly watch complicated assembly sequences so they can double-check their work and self-correct errors.
Entry-level workers can use AR-based training for self-learning.
AR allows a one-to-many, instructor-to-trainee paradigm, which may reduce overall training costs.
Instructors can gather user analytics and monitor the learning status of a group of novice workers during training, continually fine-tuning their instructions.
If veteran workers can contribute their knowledge and experience to the creation of AR-training content, it facilitates the transfer of knowledge to entry-level workers.
Could AR Disrupt an Entire Industry?
Our UX team specifically looked at the possible disruption of a paper-based, lean assembly process by the introduction of AR work instructions. The data from our study appears to support this. AR work instructions can significantly improve many common usability metrics in comparison to paper-based, exploded-view work instructions.
However, before we can altogether concede to Tim Cook’s assertion that AR will change the way we use technology forever, we must ask another question: Is AR the most cost-efficient solution, or are there less expensive technologies that we could use to provide similar improvements? For example, could model-based instructions (MBI) on a tablet yield similar results at a fraction of the cost? It would be necessary to undertake a cost-benefit analysis (CBA) to answer this question. Taking a systematic approach to estimating the strengths, weaknesses, and cost of AR work instructions—as well as other modes of instruction—would help determine whether AR could disrupt an entire industry or, at the very least, lean assembly.
References
Sauro, Jeff. “SUM: Single Usability Metric.” MeasuringU.com, April 17, 2005. Retrieved February 2, 2017.
Kruger, Justin, and David Dunning. “Unskilled and Unaware of It: How Difficulties in Recognizing One’s Own Incompetence Lead to Inflated Self-Assessments.” Journal of Personality and Social Psychology, June 10, 1999. Retrieved February 2, 2017.
John believes in The Method, which lets a designer define the actual problem to be solved. It is a meticulous process involving discovery research, rapid design iterations, and the quantification of success. It is possible to adjust this process based on time and resource limitations. The Method elevates design thinking to encompass company goals—regardless of whether the platform is Web, mobile, or augmented reality (AR) on a head-mounted display (HMD). John’s pre-Internet design career began with the design of interactive CDs. His career has continued through the dot-com boom and bust, the emergence of interactive TV, mobile, and now the promise of AR. John has worked with consumer companies such as Disney, Fox, and TV Guide; large enterprise companies such as Siemens and GE; and emerging startups such as Procore. Read More
Principal, UX Strategy & Research at ADP Innovation Center
Adjunct Assistant Professor at Art Center College of Design
Pasadena, California, USA
For more than 15 years, JD has successfully led the introduction of user-centered research initiatives for a variety of entertainment, automotive, and medical products, working for both disruptive startups and enterprise organizations, including Yahoo, Disney, Idealab, DirecTV, Kelley Blue Book, Kaiser Permanente, and Daqri. She is a passionate advocate of collaborative, cross-functional design, multimethod user research, and data triangulation. Her work inspires and informs innovative solutions. Read More