Eight years ago, on July 10, 2008, the iPhone App Store opened and the mobile app-development ecosystem was born. Then, just a few months later, on October 22, the Android Market came into being. Businesses, developers, and mobile users would never be the same. According to Statista, mobile app revenues are forecast to grow to $76.52 billion in 2017, which is roughly equal to $10 for every person on the face of the Earth!
Businesses that want to earn a share of this enormous mobile app–revenue pie must understand and track 12 key performance indicators (KPIs) that let them measure—and, in some cases, foretell—the success of their apps—or, in the case of 99% of all apps, their demise. With the help of these KPIs, you can better understand how well an app is doing and how users are engaging with the app. Gaining this understanding is a prerequisite to comprehending why an app is performing in a certain way and how to improve its user experience.
In this article, I’ll describe the 12 most important KPIs that will help you to measure the what before you can get to the why.
Champion Advertisement
Continue Reading…
1. Numbers of Downloads and Installations
Possibly the oldest indicator of mobile-app success, the number of downloads and installations is a good gauge of an app’s popularity, but not necessarily its financial success. Facebook and Candy Crush may have a firm hold on the top spots in their respective categories, but there are plenty of apps that lay claim to a significant number of installations. According to Statista, there are about 1,600,000 apps in Google Play alone!
2. Number of Users
The number of people who use a mobile app may differ significantly from the number of installations. For example, the same user may download Skype on both a mobile phone and a tablet. More interestingly, gauging the number of users over time lets you calculate an app’s retention rate. (For more information about retention rate, see KPI 4.)
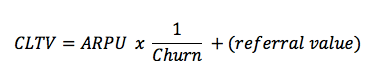
3. Lifetime Value
An app’s lifetime value (LTV) to a customer is an important metric for many reasons. This number, when you extrapolate it across all customers, drives your marketing budget and lets you derive your cost of customer acquisition (CAC). But measuring LTV requires more than simply knowing an app’s average revenue per user (ARPU). You must also factor in an app’s churn rate, the percentage of users who stop using the app, and each customer’s referral value (CRV). Figure 1 provides a good formula to use for measuring LTV. (For more information about ARPU, see KPI 7.)
Retaining a mobile-app customer is much harder than acquiring one, which, some may argue, is not all that easy in itself. Quettra’s data, which is graphed in Figure 2, shows that “the average app loses 77% of its [daily active users] (DAUs) within the first three days after its installation. Within 30 days, it’s lost 90% of DAUs. Within 90 days, it’s lost over 95%.”
Figure 2—Android apps’ retention curve
5. Active Users
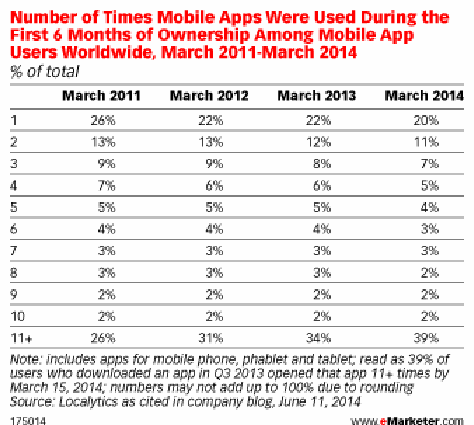
Users who regularly engage with an app are not likely to stop using the app and factor into its churn rate. According to a 2014 eMarketer report, the average app engaged 39% of its monthly active users. To put this another way, less than four of ten users who installed an app opened the app more than eleven times in the first 30 days. Figure 3 shows this data from the eMarketer report.
Figure 3—Mobile-app usage
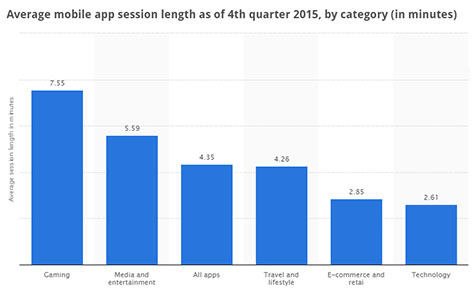
6. Session Length
The session length, or interval, is the time each user spends in an app. The average time users spend in an app varies greatly by category—from 7.55 minutes in gaming apps down to just 2.61 minutes in technology apps, according to the graph from Statista, as you can see in Figure 4.
Figure 4—Mobile-app session length
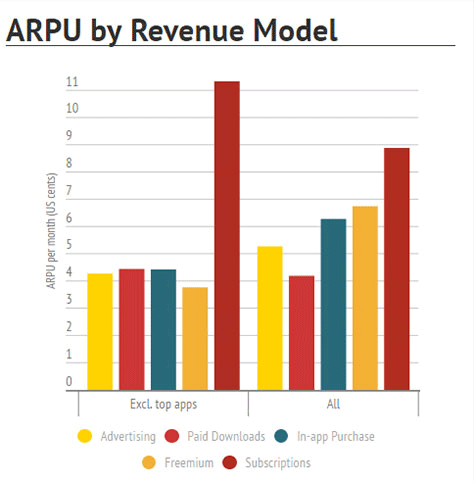
7. Average Revenue per User
An app’s average revenue per user (ARPU) is the total revenue the app generates within a given time period, divided by the total number of active users for the same period. Benchmarks for ARPU vary greatly by category, by country, and by revenue model. Figure 5 shows an example of ARPU by revenue model, from Developer Economics.
Figure 5—ARPU by revenue model
8. Cohort Analysis
By grouping mobile-app users into cohorts on the basis of various factors, you can better gauge the effects of your changes, optimizations, and monetizations for an app. For example, you can group users into cohorts based on their point in the user lifespan. By tracking the behavior of each cohort, you can better optimize the experience for users at each point in the user lifespan.
9. Number of Uses During the Initial Day or Week
It’s helpful to track the number of times a user opens a mobile app during the first 24 hours or first week after its installation. Let’s examine a model you can emulate: active users for the Facebook mobile app. As of January 2016,Facebook had 1.442 billion active mobile users per month. But only 934 million of them were daily active users. This gives Facebook a stickiness of 64.8%. To determine stickiness, divide daily active users by monthly active users (DAU/MAU).
The more sessions during which a user engages with an app, the more likely that user is to become a loyal user. Therefore, tracking the number of times users open an app during a specified period—and constantly optimizing the experience to improve that number—lets you forecast an app’s retention rate, stickiness, and eventual revenue.
10. Permissions Users Grant to an App
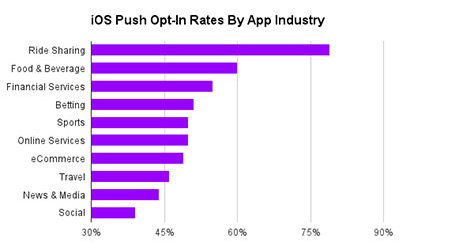
By knowing the level of permissions users grant to your app, you can understand your users’ view of your trustworthiness. One of the most important permissions users grant is allowing push notifications. For most apps, such notifications are the primary means of retaining and engaging users. However, as you can see in the graph from Kahuna, shown in Figure 6, opt-in rates for push notifications vary from over 60%—for ride sharing apps—to a low of 39%—for social apps.
Figure 6—Opt-in rates for push notifications by industry
Tracking your opt-in rates per cohort—see KPI 8—provides an indication of how much users trust your app.
11. Virality
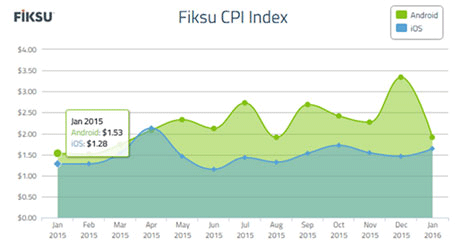
It’s every app developer’s dream for their app to go viral. With cost of installation rising—year over year, a 28 percent increase on iOS and 25 percent on Android, according to Fiksu—savvy mobile-app strategists are creating opportunities for their user base to build effective viral loops. Figure 7 shows Fiksu’s cost per installation (CPI) index.
Figure 7—Cost per installation
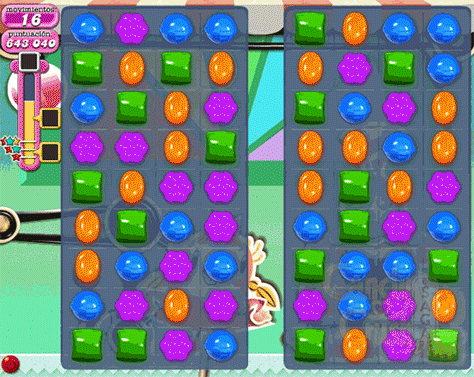
For example, the widely popular Candy Crush app, shown in Figure 8—as well as its many wannabe descendants—encourages users to ask friends for help. When engaged users find themselves unable to complete a challenging level, they can request extra lives from their friends. This creates an ever-expanding critical mass of Candy Crush addicts—loyal users who spend lots of time and money in the app and continually feed the viral machine.
Figure 8—Candy Crush mobile app
12. Crash Analytics
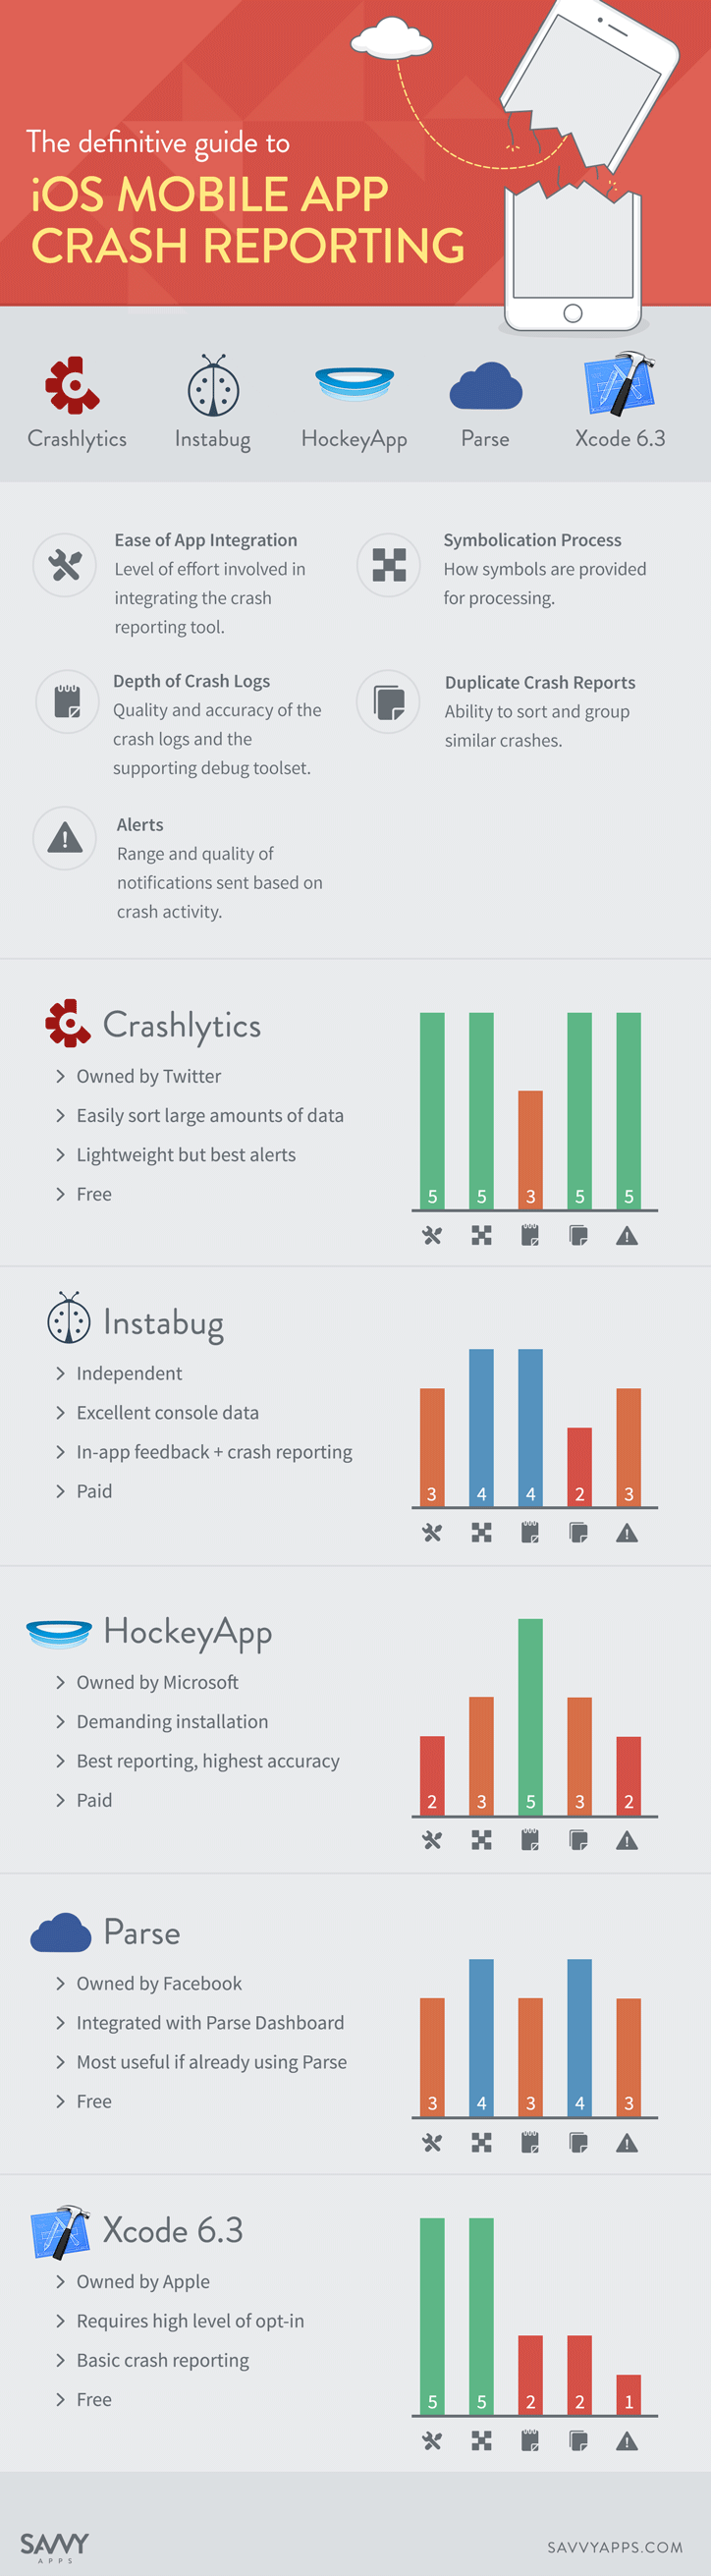
Tracking your app’s crashes per user, as well as meaningful stack traces using class names, methods, and accurate line numbers, can help you to understand the technical barriers that are harming your user experience. There are many tools that you can use to track crashes. Figure 9 shows an infographic that compares some of the most popular tools for iOS apps.
Figure 9—Crash analytics tools for iOS apps
Conclusion
Tracking these 12 metrics for your mobile apps will give you a firm grasp on the health of your business. However, understanding the what is only half the battle. You also need to understand the why. Why aren’t users registering? Why do users abandon their shopping cart? Why don’t users follow the path you want them to take within your app? You can answer these questions and others by measuring your app’s user experience—including user behaviors and in-app engagement—using a variety of tools such as session replays, heatmaps, and conversion analytics.
A lot has changed since 2008—hello, 4G wireless and Hulu!—but the rise of the mobile app ecosystem has definitely been a game changer. Mobile apps—and their developers—have evolved over the past eight years. The few standouts who are successful are the developers who track these 12 critical KPIs, as well as their apps’ user experience, user behaviors, and in-app engagement. Those developers truly understand what users are doing in their apps and why. Armed with this knowledge, mobile app developers can improve their mobile user experiences to engage and retain users over the long term.
Thanks for including our entire iOS Mobile Crash Reporting infographic in this article. We would very much appreciate it if you at least included a link back to us as credit for using our work. Our Web site. Our blog.
As VP of Marketing at Clicktale, Yael leads the company’s worldwide marketing initiatives, driving awareness and adoption at global, Fortune 500 companies. Yael has a global perspective on marketing, having lived and worked on three different continents—and counting. Prior to joining Clicktale, Yael held product and strategy roles at various companies, including MediaMind—now Sizmek. Yael holds an LLB from Hebrew University and an MBA from MIT Sloan School of Management. Read More