You’ve probably heard the popular saying that a picture is worth a thousand words. As UX design professionals, we make our living by communicating clearly through the use of visual elements and affordances, thus, enabling the productivity of others. If we do our job well, we seldom need to rely on using many words. Instead, the visualization skills that we hone through our profession benefit not only the users of the products we design; if we leverage them correctly, they also make our colleagues, stakeholders, and ourselves more productive.
Productive teams are typically teams that communicate well and have a shared understanding of what they’re trying to accomplish. Their shared understanding often stems from expressing their ideas and concepts in unique ways that gain stronger footholds in the minds of others, which fuels the team’s greater productivity. While there are many methods of expressing ideas and concepts that could aid our productivity, we’ve found that creating mind maps is one of the most effective techniques because of its versatility and scalability.
Champion Advertisement
Continue Reading…
In this column, we’ll delve into mind maps, answering the following questions:
What is a mind map?
Why is a mind map so effective?
How do you start creating a mind map?
What tools should you use to create a mind map?
What Is a Mind Map?
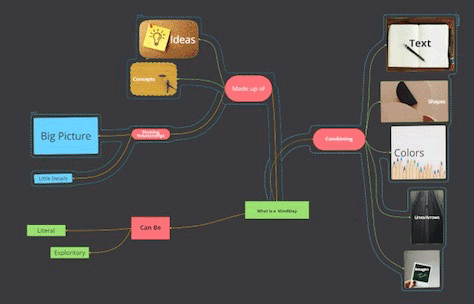
A mind map takes ideas and concepts that can be both literal and exploratory and expresses them using text, shapes, colors, lines, arrows, and images, showing the relationships between them. Depending on the use case, a mind map can contextualize high-level concepts, minute details, and everything in between.
We recommend that you use mind maps when you are:
trying to resolve an overly wordy or unproductive conversation
simplifying verbose documentation
describing technical features
attempting to clear up confusion
introducing new ideas
aligning and bringing consensus to teams
simply listing out items
Why Is a Mind Map So Effective?
A mind map reduces cognitive load, increases our memories of a topic of discussion, holds our team’s attention, and can sometimes provide a start-to-finish guide that shows what you are trying to accomplish. Let’s dig a little deeper into the following aspects of the benefits of mind mapping:
cognitive load
memory retention
attention
guided ideation
Cognitive Load
When we connect text with visual elements such as shapes, colors, lines, arrows, and images to express ideas and concepts, we both increase our attention and reduce cognitive load. Viewers or participants in a mind-mapping session no longer need to remember the entire conversation word for word because most of the concepts are expressed through the visualizations. Plus, the novel use of various shapes and colors enables viewers’ brains to avoid the same tired neural pathways they usually use, offloads them to underutilized pathways, and, thus, expands their mental capacity.
Some of the best brain exercises we can do are those that force us to do something differently. Part of the process of offloading involves recruiting the cognitive abilities that each of us possesses, but seldom use. Some simple ways of activating your brain in a different way include taking a different route to work, reversing the order in which you typically take a hike or jog, or brushing your teeth with your nondominant hand. Doing things differently can ultimately help you offload your worn-out cognitive baggage. The same principles apply to our abilities to convey new concepts, understand ideas, and collaborate with our teammates.
Memory Retention
Placing text, shapes, colors, lines, arrows, and images on a mind map is similar to drawing. Drawing our ideas helps with memory retention because it recruits other cognitive abilities that we possess, but probably do not use. There is science to this: The Drawing Affect. In addition to the act of drawing, when you group ideas and concepts to show their similarities and differences, you are also improving your memory retention. There is copious research behind memory retention, which involves the chunking of ideas and concepts. When you are chunking ideas—for example, grouping elements such as text, shapes, colors, lines, arrows, and images—you are creating special areas in your mind map that become hot spots for memory retention. According to the Method of Loci, these special areas are highly conducive to recalling information and aid memory retention.
Attention
Just as with sensory-appeal marketing, mind maps engage participants’ five senses as they create the map—especially if they create it when working face to face. This fosters participants’ understanding because, the more senses participants use, the greater their engagement with a task or activity. It also leads to richer discoveries. While many of us now work remotely—either fully or partially —as a result of the COVID-19 pandemic, there may be times when we’re co-located for team-building or collaborative activities. If your UX design, product, or Scrum team is planning to get together, why not give mind mapping a try, especially if you have a problem you need to solve collectively?
Another benefit of the way in which a mind map impacts our attention is how it takes advantage of body-mind integration. As you write text or draw shapes, colors, lines, arrows, and images, your body becomes more engaged in the process. This body-mind integration deepens the attention you’re putting into the task of discovery.
However, with our new predominantly remote or hybrid work reality, we might not always have the benefit of being together. But don’t let this dissuade you. Try mind mapping in a virtual context, using one of the tools we’ll cover later. While this won’t engage all your senses, the act of authoring textual content, drawing digital lines and shapes, and dragging and dropping elements onto a canvas still activates different mental muscles than you would otherwise engage when creating conventional media such as word-processing documents or slide-show presentations.
Finally, creating a mind map increases participants’ attention because teams can choose to disclose certain parts of an overall map progressively as they pursue their journey of discovery. Depending on the problem you’re solving, having to focus on the entire picture, all at once, can be overwhelming. We’ve maintained participants’ attention by not showing them everything at once and, instead, introducing concepts in sections or chunks as we advance through a topic or series of topics.
Guided Ideation
Another benefit of progressively disclosing the topics in a mind map is that it supports guided ideation, which can also be useful in understanding an existing mind map. Guided ideation lets you order or even reorder a mind map’s content, then progressively disclose the ideas you generated to give participants the benefit of focus. A team can complete an ideation session after introducing and discussing each idea in turn. Focusing on too many topics or ideas at once can be overwhelming to participants. As Jon pointed out in his UXmatters column, “Building Narrative into Your User Interface, Part 1,“ imposing sequence gives people a clearer sense of order as you guide them through a task-based workflow. In addition to fostering participants’ focus, guided ideation is another way of reducing cognitive load and building momentum into an activity.
People feel satisfied when they can declare victory after they’ve completed smaller, more attainable tasks rather than having to complete everything at once. Similarly, the agile-development methodology favors getting smaller feature sets to a shippable state rather than an entire application. Why shouldn’t the same methodology apply to our approaches to ideation?
How Do You Start Creating a Mind Map?
As you’ve probably noticed, mind maps can scale broadly to any number of practical applications. So where should you begin? The first step is just like drawing by simply starting with the first idea you think of regarding a subject you’d like to explore. You can express your idea through text, shapes, colors, lines, arrows, images, or any combination of things that comes to mind. It’s okay to act on impulse, and you should resist the urge to filter or edit your initial thoughts. Next, add more ideas. As you progress, ask yourself whether you see patterns or connections between the ideas. Circle these patterns, draw lines to represent the connections you discover, then repeat.
Another important aspect of successfully getting started with a mind map involves people. As UX design professionals, we typically consider the user persona for whom we’re designing, first and foremost, taking into account their goals, contexts, and use cases—all of which should inform the initial ideas that we capture, whether digitally or physically. The same mindset should apply when you start a mind map. While we cannot go into every persona, define every use case, or cover every context, we’ll provide the following examples, which might be applicable to the type of work you’re doing:
page- and feature-mapping with developers
feature brainstorming with key stakeholders
aligning product teams on the overall product vision
Page- and Feature-Mapping with Developers
When developing any software solution that supports users’ ability to navigate an application or Web site that comprises multiple pages, it helps to understand how the features on certain pages are similar or different to help reduce the duplication of code.
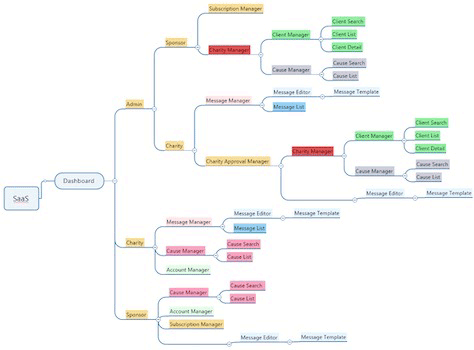
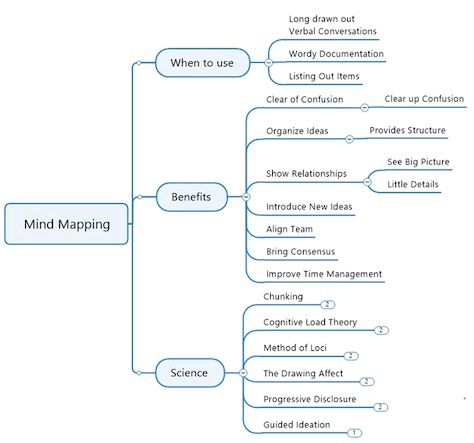
As Figure 1 shows, Tasha and the developers with whom she works began mapping a number of different use cases that justified the need for specific features and determined where to locate them. For related use cases, they created text and lines in the mind map that showed how the use cases connected. After connecting all the features in the map, they were able to see what use cases and related features were similar and different, which ultimately let them color-code parts of the workflows to make their similarities and differences more obvious. The collaboration with developers became more productive because they had forged common ground.
Figure 1—Example of a mind map created using Mind Manager
Feature Brainstorming with Key Stakeholders
Figure 2 shows a mind map that Tasha created for a yoga-studio owner who wanted to offer a richer set of digital features to clients because the pandemic had increased the demand for better remote experiences, but wasn’t sure where to start. Tasha began by questioning the owner about the various personas who make up the client base, then used those personas as the catalyst for creating a mind map. Through their conversation, Tasha was able to identify five different personas, but had explored only two of them when several ideas emerged that would satisfy all personas. The act of visually mapping out the ideal experiences for a subset of user personas led to richer discovery in just four hours.
Figure 2—Example of a mind map created with Coggle
Aligning Product Teams on the Overall Product Vision
A mind map can take several forms, including a paradigm called an event storm. In their Lucidchart.com blog post, “Event Storming 101: Accelerating Your Software Development in Domain-Driven Design,” the Lucid Content Team defines an event storm as follows: “A rapid group modeling approach to domain-driven design.” This workshop-style approach can be an “ideal technique that brings project stakeholders together—both developers and nontechnical users—to explore complex business domains.”
In our experience, an event storm is an ideal approach for teams collaborating on an overall vision for a product because it focuses at a high level and gives participants permission to think broadly rather than burdening themselves with technical details.
Often, this approach starts by identifying certain events in a system or process. Teams can color-code events in whatever way they want, whether using physical sticky notes, if working in person, or digital cards, if working remotely. They can then identify certain triggers for those events—whether externally triggered or internally influenced—and highlight those using a different color. Finally, they can pair events with certain system or process reactions such as notifications or alert messages, highlighting them using yet another color and providing a clear definition of the cause-and-effect behaviors of an overall system or process.
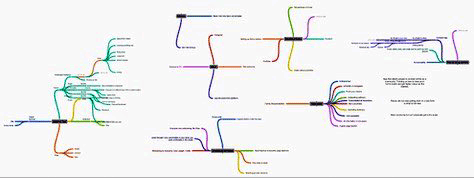
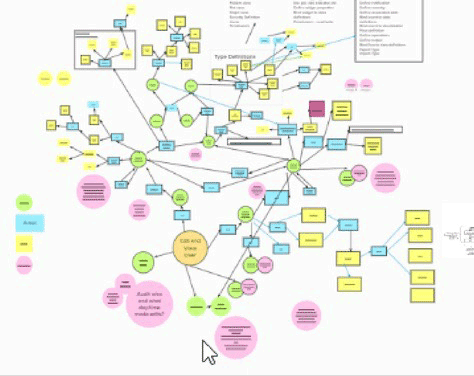
Figure 3 shows an example of an event-storm mind map that Tasha created with her product team using Mural. (We’ve zoomed out on the map to obscure some sensitive information, but you can get a general idea.)
Figure 3—Event-storm mind map the team created using Mural
What Tools Should You Use to Create a Mind Map?
A mind map is ideal for in-person collaboration, but there have never been better digital tools and solutions for mimicking the in-person dynamic. The following are some tools we’ve found useful for creating mind maps:
Coggle
Mindo
Creatly
Ayoa
Miro
Mural
Figjam
Coggle
If you are looking for a free, Web-based tool with basic features, Coggle might be the best solution for you. Its functionality is simple, letting you create a center node with items that branch off of it, which is sometimes enough for some spur-of-the-moment brainstorming and collaboration. Tasha used Coggle when collaborating with the yoga-studio owner.
Mindmo, Creatly, and Ayoa
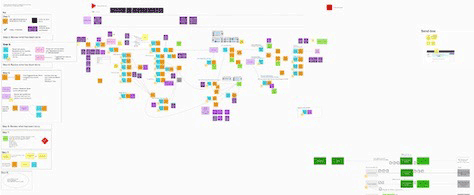
Each of these Web-based tools offers a free trial, as well as paid subscriptions. They are more advanced than Coggle, allowing you to add images, shapes, and colors to your mind maps. Figure 4 shows a mind map in Ayoa.
Figure 4—Example of a mind map created using Ayoa
Mind Manager
Mind Manager is one of Tasha’s go-to’s because it is very easy to use. Although it doesn’t yet work well for collaboration, it provides a desktop client for both the Apple OS and Windows platforms. Plus, the Mind Manager team is hard at work on a Web-based version. Figure 5 shows a mind map in Mind Manager.
Figure 5—Example of a mind map created using Mind Manager
Miro and Mural
Miro and Mural are both whiteboard tools that include mind-mapping features. You can add a mind map to a canvas. While both tools are highly collaborative, Tasha thinks Miro’s mind-mapping features are more robust at the moment. Figure 6 shows an example of a mind map in Mural, which we’ve blurred to protect some sensitive information.
Figure 6—Example of a mind map in Mural
Figjam
Figjam is an up-and-coming competitor to Miro and Mural and is a convenient extension to Figma, another go-to design tool on which the Rockwell Automation UX design team is standardizing. While we’re still discovering all the benefits of Figjam, we think it could replace other mind-mapping tools we’ve used because of the level of support through Figma and its adoption across the UX design community. However, things might become more interesting with Adobe’s recent acquisition of Figma.
Final Thoughts
If you’re new to creating mind maps, you may stumble at first. That’s okay—and should be expected. But, after a few tries, you’ll start to see patterns in your mind maps and begin to hone a process that works well for you. No two mind-mappers are the same, and everyone’s goals and objectives differ.
If you are planning your first mind-mapping workshop, we recommend finding one person who knows the topic as well as you do, with whose help you can conduct a dry run and accomplish what you hope to achieve with a larger group of participants. This will help you anticipate how the overall flow of the activity might play out. Plus, you might realize that you need to add more specific meaning to your shapes, colors, images, and other affordances—as Tasha has discovered through her own dry runs. Practice makes progress!
Finally, when you are ready to collaborate with the larger group, it’s important to go slow at first. Don’t assume that everyone is starting at the same level of alignment or with the same expectations of the activity. Make sure that everyone is participating. Pause often to give participants opportunities to ask clarifying questions or give feedback on how to make the most of the session.
We often like to ask probing questions such as the following:
“Is that what you were thinking?”
“Can you delve a little deeper into your intent for that idea?”
“How do you feel about our progress so far?”
Such questions can promote greater participation, encourage each participant to feel engaged, and ensure that everyone is an integral part of the activity. When mind-mapping collaborations are executed well, they can lead to some of our most successful product designs and, in turn, lead to the best outcomes for our customers and users.
Director of User Experience at Rockwell Automation
Cleveland, Ohio, USA
Jon has a degree in Visual Communication Design from the University of Dayton, as well as experience in Web development, interaction design, user interface design, user research, and copywriting. He spent eight years at Progressive Insurance, where his design and development skills helped shape the #1 insurance Web site in the country, progressive.com. Jon’s passion for user experience fueled his desire to make it his full-time profession. Jon joined Rockwell Automation in 2013, where he designs software products for some of the most challenging environments in the world. Jon became User Experience Team Lead at Rockwell in 2020, balancing design work with managing a cross-functional team of UX professionals, then became a full-time User Experience Manager in 2021. In 2022, Jon was promoted to Director of User Experience at Rockwell. Read More
Lead User Experience Researcher at Rockwell Automation
Cleveland, Ohio, USA
At Rockwell Automation, Tasha helps people visualize her research findings. Visualization is her passion. This quotation from Albert Szent-Gyorgui guides all that she does: “Research is to see what everybody else has seen and to think what nobody else has thought.” Tasha has been a key contributor to many industrial-automation innovation projects at Rockwell—from FactoryTalk® Hub and FactoryTalk® Vault to Remote Access and some of Rockwell’s leading analytics solutions. The goal of her research is to understand customers’ technological needs. In the past, Tasha has worked as a front-end developer and a UX designer. She is an active member, presenter, and board member of Akron Women In Tech, a community that focuses on learning and growing through technology. She has a bachelor’s degree in Computer Engineering from the University of Toledo and a master’s degree in User Experience Design from Kent State University. Read More