To stay relevant and avoid disruption through advances in technology or globalization, more and more organizations have embraced user-centered design and UX research methods. Thus, after years of fighting for a seat at the decision-making table, it is becoming more common for UX professionals to find one there. Still, executives often ask UX teams to quantify the value and return on investment (ROI) of their UX efforts. While calculating the ROI of User Experience can be challenging for consumer products and services, it can be truly daunting in enterprise organizations.
This series of articles will describe our journey of discovery in learning how to measure the ROI of User Experience at a large, Fortune-500 company that develops human capital management software and services.
The company had made the decision to invest in several innovation centers throughout the US. Observing the adoption of User Experience in other large enterprises such as IBM, General Electric, Capital One, Honeywell, Philips, and JPL, they came to believe that user-centered design was an essential component of the innovation equation. Therefore, they established our UX team just over three years ago.
Champion Advertisement
Continue Reading…
Our UX team’s primary focus is on reinventing and improving the compliance process for payroll. Compliance includes making sure companies pay the appropriate taxes on their employees’ wages and can deduct garnished wages from employees’ paychecks correctly.
Behind the Redesign
The team had just settled in—after around one and a half years—when we were unwittingly propelled on our journey toward our UX return on investment endeavor. From our team’s inception, we had decided to establish the groundwork for our user-centered design process by interviewing our internal stakeholders and subject-matter experts, as well as by going out into the field with cross-functional teams to observe our users. We had even begun to establish UX research best practices—for example, creating our own customized research participant database and instituting the practice of recording and transcribing field and remote contextual-inquiry sessions.
A unique opportunity presented itself just as we were gaining momentum, and we were able to convince executives to green-light a redesign release of our main product platform that had been delayed for two years. It was around that same time that we were asked to prove our UX teams’ value to the organization quantitatively.
The Redesign Realization
After several team meetings—and once our initial concerns had dissipated—we realized that the intense organizational focus on and support for the redesign was giving us rare access to a significant research budget. This awareness encouraged us to start thinking more strategically. Although the main product platform had been around more than five years, no one had ever performed an end-to-end assessment of it from the user’s perspective.
It is hard to know where you’re going if you don’t know where you’ve been. So we believed we couldn’t begin any real effort to measure the impact of user-centered design methods and practices on the organization’s bottom line unless we had a starting point of comparison. We began to understand that we had to establish a baseline prior to the redesign effort if we wanted to take full advantage of this window of opportunity. To achieve this, we would first need to identify our users’ top tasks. Then, we could create a benchmark, measuring their attitudes, behaviors, and processes in relation to accomplishing those key tasks.
By collecting those same measurements after the redesign and comparing them to the benchmark measurements, we hoped to reframe design conversations about the future user experience.
Further, once we had collected our before- and after-redesign benchmark metrics, we could show a connection between our users’ experience of the redesign and company success metrics. If we could accomplish all of this, we could potentially quantify our team’s value and impact on the organization.
An additional complication for our endeavor was the redesign release schedule. The launch date for the platform was set for December, right before the holidays. This meant we had approximately ten weeks to complete our design and development process. If we were going to measure the existing platform experience as a baseline, we would have to recruit research participants, establish the appropriate UX metrics, collect and verify our users’ top tasks across several products, and execute a benchmark analysis—all within that timeframe.
Developing a UX Measurement Plan
As UX researchers, we started by referring to various articles, whitepapers, books, and Webinars that described the development of a UX ROI measurement plan. There were endless theories and a recent flurry of articles, meetups, tweets, and conference presentations, but limited tactical specifics—especially dealing with the complexities of enterprise organizations.
We were able to identify a few basic steps. However, there were surprisingly few details regarding how to plan and measure UX design efforts and connect those efforts to business metrics. Even less information existed about exactly what UX metrics would best correlate to company-level key performance indicators (KPIs).
Leveraging the readily available information we were able to collect as a starting point, a few common recommended steps started to emerge:
Clarify a representative audience.
Establish the company KPIs.
Establish UX metrics.
Identify users’ top tasks.
Benchmark the user experience.
Map the UX metrics to the company KPIs.
Create a plan to improve the metrics.
Understand how design changes impact the company KPIs.
Compute an ROI.
Perform a periodic UX audit.
Recruiting Magic
The team understood that succeeding at the first step, clarifying our representative audience, would require overcoming two major obstacles. First, in an enterprise environment, recruiting even small numbers of participants for qualitative research can be a real struggle.
The team had already faced some hurdles—such as limited client access because of the sales team’s concerns, restrictive company policies regarding security and privacy, and even seasonal availability of representative users. So we knew recruiting the potentially hundreds of respondents we would need for a quantitative study would require a combination of effort, precise timing, and a little luck.
Second, while the organization understood that the compliance product’s primary user is a payroll practitioner, the UX team’s field research had begun to reveal that this user was less monolithic than we had originally assumed. In fact, the payroll practitioner might be one individual in a smaller organization, but in larger companies, several individuals might cover the same role, with each performing a specific, small subset of an entire workflow. This insight increased our need for a respondent list with complete, up-to-date descriptive information for each contact name.
From our enterprise UX team's original formation, we had understood the importance of having a dedicated UX research-participant recruiter. Fortunately, our team includes an intrepid research recruiter, who took on the task of networking through the various silos and sales teams to find the right contact lists—at almost the last minute. She also managed the job of scrubbing and filtering contact opt-outs to meet CAN-SPAM Act requirements, negotiated with finance and legal to procure approved incentives, and synchronized the distribution of recruiting email messages to ensure we met our response quotas.
Selecting Measurable UX Metrics and Identifying KPIs
Most enterprise organizations thrive on various types of data. For example, sales volume, customer contacts, and even Net Promoter Score (NPS). However, the silos that are typical of most large, sales-driven enterprise organizations can make KPIs hard to find and even harder to decipher. At the same time, some UX professionals are metric-phobic. But our team realized that retaining our seat at the decision-making table required a laser focus on the next step in our process: identifying the most important company KPIs.
Since the UX team was new to the organization, we educated ourselves by reading company blogs, quarterly stock reports, and executive email announcements and watching corporate videos. Our search for exactly the right UX metrics also prompted us to ask infinite questions: Which UX metrics would best capture the influence our team had on the user’s experience? Which UX metrics would best reflect the changes we hoped to make in the user’s experience over time? Equally important, which UX metrics would make the most sense to executives?
While a lot has been written about usability and customer-experience measurement instruments such as the System Usability Scale (SUS), Total Addressable Market (TAM), Standardized User Experience Percentile Rank-Questionnaire (SUPR-Q), and even NPS, each of these tools measures a slightly different aspect of usability or satisfaction. For example, some are better suited for measuring Web sites than enterprise software.
In the end, we decided to combine several metrics, while leveraging key questions from others to develop a product-health index. This approach allowed us to see changes from our benchmark across subsequent design iterations, which both stable and more volatile metrics reflected.
After quite a bit of discussion, and with some reservations, we also decided to include NPS—even though most would consider it a customer- or market-research metric. We knew our Customer Experience (CX) team was also gathering NPS data on customer service, as well as the product experience, and we reasoned that this would give us the ability to compare and contrast our results.
Top-Task Identification
The team understood that steps four and five were crucial and would form the foundation of any plan to measure UX ROI. It was essential that we conduct top task-identification research, then follow it up with a benchmark study.
Completing these two steps allowed us to tell our users’ story—first, by clarifying their primary tasks, as well as their attitudes about those tasks. The top-task research gave us the opportunity to identify and focus on our users’ highest priority tasks, while reducing our attention on smaller tasks that mattered less. Then, before the redesign, we actually measured the performance of these tasks.
Gerry McGovern, author of “Transform: A Rebel’s Guide for Digital Transformation” and advocate of the Top-Task Management method, has worked with countless Fortune 1000 companies, including Cisco, IBM, Microsoft, and Wells Fargo. He describes Top-Task Management as an opportunity to “reduce complexity by identifying what matters most to customers.” He lists the following major steps of a top-task identification process:
Engage the entire organization in a process of gathering customers’ tasks.
Work with key stakeholders to come up with a short list of these tasks.
Get a representative sample of customers to vote on their top tasks.
Create a prioritized table of tasks, starting from the task with the highest number of votes down to the one with the lowest number of votes.
When putting McGovern’s guidelines into practice, our team borrowed a technique that is commonly used in anthropology, called freelisting, to discover our users’ end-to-end tasks. Freelisting is a simple technique in which you ask an individual or a group to “list as many ideas or items on [topic X] as you can.” By surveying our internal subject-matter experts, we gathered a list of our users’ most important, or high-priority, end-to-end tasks through a quick survey.
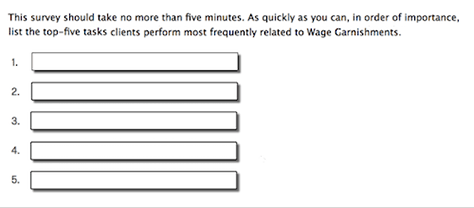
Figure 1 shows our freelist survey, which let us develop top tasks from our internal subject-matter experts in Qualtrics.
Figure 1—Freelist survey to develop a list of top tasks
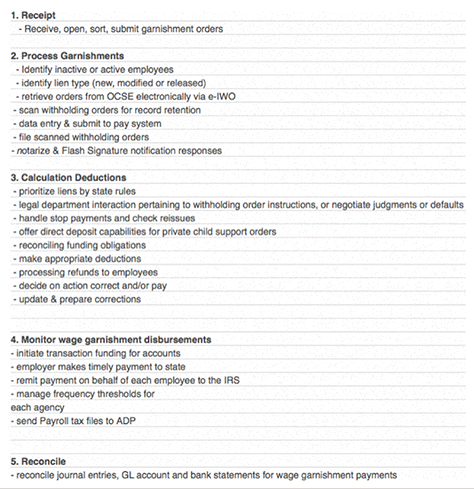
Second, to create the short, aggregated list of these tasks shown in Figure 2, we incorporated insights that we had gleaned from our ethnographic field-research visits, stakeholder interviews, sales and business presentations, and even analytics data, in addition to the freelisting data.
Figure 2—Steps in our users’ process and associated top tasks
Next, we recruited a small number of users to review our final freelist results for task wording and accuracy. To complete our top tasks-identification process, we established a recruitment criterion of at least 200 respondents, which would allow us to be 90% confident that our survey results would be representative of an average compliance product user.
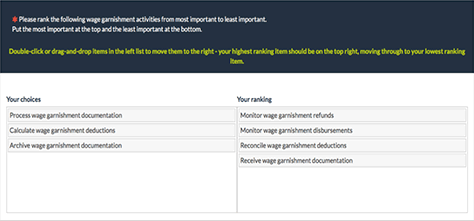
Finally, working with an external research consultancy, we launched our top-task survey to thousands of users to identify the steps in our users’ process. As shown in Figure 3, we asked each participant to rank the steps in their process in terms of importance and satisfaction. Then, as shown in Figure 4, we asked users to identify the individual tasks that made up each process step and prioritize them.
Figure 3—Top-task survey with forced ranking to identify process steps Figure 4—Top-task survey with forced ranking to prioritize users’ tasks
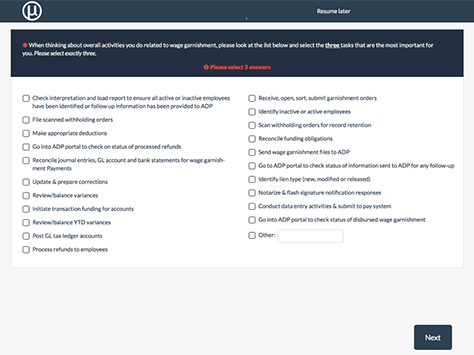
In addition to taking the ranking survey, participants answered questions relating to demographics—for example, work experience, frequency and intensity of product usage, and experience level. They also rated our platform product’s functionality, performance, overall satisfaction, trustworthiness, and credibility.
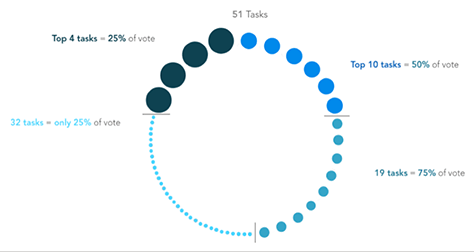
The most important outcome of our top-task survey was a ranked, prioritized list of process steps and tasks. The results of our research allowed us to see not only the top-ranked tasks across different products, but also to identify the lower-ranked tasks. Plus, we were able to see how each task ranked in relation to other tasks.
Using a subset of the key tasks we had identified through our top-task survey, we conducted a benchmark study. We employed a combination of remote moderated and unmoderated methods, which let us establish a baseline we could compare against the initial redesign, as well as future iterative releases.
After some discussion, the entire team agreed that this quantitative approach would provide insights in a manner that would balance our qualitative efforts. Plus, quantitative research offered the additional benefit of letting us explain the UX team’s impact using numerical data, which can sometimes be easier to communicate than qualitative data, especially to executives.
Making Friends with Finance and Other Important Alliances
The next step in our UX ROI measurement plan, mapping UX metrics to company KPIs, would require the help of a financial heavyweight. It became obvious to us that joining forces with our Finance team would be critical to our project’s success.
Even though we knew our team’s Senior UX Director was good at making connections across the organization, we were still surprised when she appeared in our open office environment one afternoon with the new CFO in tow. Although she was still acclimating to the organization, our new CFO was financially innovative and progressive. Even more important to the goals of our UX ROI measurement plan, after a few conversations, she was quickly able to make the connection between UX improvements and their contribution to the metrics the company measures. She already had the objective of aligning revenue metrics across the various siloed divisions, so she became a vital partner in terms of her translating the language of finance and helping us focus on the right company KPIs.
We also joined forces with a new Customer Experience VP whose team had recently taken on the task of establishing revenue standards, relating them to sales and service metrics such as sales growth and cost per customer contact—and, of course, NPS.
We knew that all our measurement efforts would be pointless if we didn’t have a plan for achieving Step 7—using these new insights to improve our product experience. Working with Product Management teams to influence the product roadmap was key to making our research actionable.
Many UX professionals have experienced product roadmaps that end up being nothing more than a never-ending list of disjointed features and functionality. In contrast, we needed to significantly improve users’ high priority, end-to-end tasks and satisfy their most important needs. To prevent teams from prematurely translating our top-task data into features, we advocated for first clarifying our users’ unmet motivations and needs by articulating them as UX design principles. Plus, to enable the UX team to proactively influence the product roadmap, we proposed a series of workshops. Working collaboratively with our partners in Product Management, we would map the top tasks to the design principles we had identified through our qualitative field research.
By combining the information from our various qualitative research activities and the behavioral data from our benchmark study, we intended to discover why, how, with whom, and when users were conducting these top tasks. This process would provide the opportunity to look for gaps and assess whether proposed features and functionality on the current product roadmap aligned with our users’ most important needs and newly identified task priorities.
Establishing Our UX Team’s Brand Influence with Innovation Metrics
Our team had two main goals for our UX ROI measurement plan:
To establish the organization’s return on investing in a UX team by demonstrating the connection between the redesign, user experience improvements, and company KPIs.
To measure our team’s ability to foster innovation and, thus, positively shape the company’s culture and our brand.
By advancing the use of design-thinking methods and practices, we hoped to drive the company’s commitment to a user-centered design process. Innovation metrics would include activities such as design-thinking training sessions across various teams and divisions, patent filings, conference talks, UX guest speakers at our innovation labs, and articles published by our team members.
We realized that it would take several measurement cycles before we would be able to see significant brand influence from our team’s efforts. Nevertheless, we continue to work with the Marketing and PR teams to examine social-networking mentions and other indicators of our team’s impact on brand awareness.
Connecting UX Metrics to Company KPIs
One of the final steps in our UX ROI measurement plan requires us to determine which of all the UX metrics that we have gathered have the strongest and most explanatory relationship to company KPIs.
By comparing shifts in UX metrics between our benchmark and each iterative redesign effort, we think it’s possible to determine which aspects of users’ attitudes, behaviors, and product satisfaction have the strongest impact on specific organization-level KPIs—thereby offering the largest return on investment for our UX team’s efforts.
Therefore, after each measurement study, we examine changes in both UX and organizational KPIs to answer a few key questions, including the following:
Which company KPIs most strongly reflect our UX team’s efforts?
Which company KPIs should we emphasize—versus those we should deemphasize—because they would best reflect UX impact going forward?
In comparison to the benchmark, what improvements in our metrics can we reasonably expect for UX redesigns in the future?
Approximately six months after our redesign’s release, we saw the first measurable indication of our impact after comparing the results of the redesign to the benchmark experience. For that comparison, we collected the same metrics as in our benchmark study to reveal any changes that resulted from our redesign efforts—whether positive or negative.
We found it encouraging to see statistically significant trends in the desired direction for several metrics—even though they were only marginally so. Even more important, to address those metrics that hadn’t moved in the direction we had hoped, we were able—perhaps for the first time—to focus UX resources on more targeted efforts.
Lessons Learned
While what we’ve learned from our effort to measure the ROI of User Experience is exciting and the future is promising, we know this story isn’t over. To ensure we remain aware of the impact our design efforts are having on our users’ experience, the final steps in our UX ROI measurement plan require that we establish a biannual cadence for our measurement initiative. We’re collecting metrics continuously and periodically reexamining what metrics truly reflect the impact of the UX team on both our users’ experience and the company’s KPIs.
At this point, you may be thinking that the story of our UX ROI measurement program proceeded smoothly, encountering no roadblocks or setbacks. Unfortunately, that wasn’t exactly what happened. From the very start, when we conducted our initial pre-redesign benchmark study, our team ran into problems. We had trouble creating a controlled research environment.
For example, to precisely control our study results, especially task times and completion rates, our original experiment design called for the application in the research environment to be pre-populated with dummy data. Unfortunately, as our development team prepared for the release of the redesign, test environments became scarce and development resources were not available to prepare and maintain our research environment.
Ultimately, we had to create UX metrics that would compensate for wide variations in our users’ experiences and make concessions such as allowing participants to use their own working platform during the research sessions.
While we sought help from the UX community, we found that—even though many of our colleagues in the UX world were talking about measuring UX ROI for their organization—when we reached out to ask them questions, very few UX teams could discuss specifics about their UX ROI measurement plans or the impediments they encountered in trying to achieve their plans.
Even though we thought we had surpassed every imaginable major hurdle, when we conducted our second comparison study, our recruitment email message went out the very same week as a major, world-wide ransomware attack!
Our UX ROI measurement initiative has required significant effort—from recruiting to project management to moderating and facilitating multiple research methods. Whenever we conduct these studies, our small, four-person UX research team must also juggle other projects—each of which has its own looming deadlines and requires design and development resources.
After a lot of trials and tribulations, making infinite compromises and trade-offs, shedding a few tears, and even cracking a tooth, we’ve somehow managed to survive conducting both our benchmark study and our first comparison study.
Creating Our UX ROI Playbook
Most important, we’ve actually started consolidating what we’ve learned to create our own UX Measurement Plan framework, which includes the following key steps:
Clarify a representative audience.
Identify users’ top tasks.
Define UX metrics.
Benchmark the current experience.
Compare the redesign to the benchmark.
Connect UX metrics to company KPIs.
While this list of steps may look simple, as we alluded to earlier, following this process wasn’t. Over the course of the last year, we’ve learned the following lessons:
Getting access to a list of representative users within an enterprise environment requires a little magic and a lot of networking with various sales teams.
Our internal subject-matter experts’ perspectives on users’ daily tasks were somewhat more subjective than expert.
Defining the right UX metrics should start with broad strokes rather than specifics.
Conducting your first benchmarking study requires infinite trade-offs and always leaves you wondering.
The first comparison study, in which you compare your redesign to your benchmark, is likely to be less a big bang and more a subtle sigh of relief.
Connecting UX metrics to your company KPIs requires the heart of a UX professional, but the soul of an economist.
As we continue developing our UX ROI measurement initiative, we’ll keep revising and tweaking these process steps, as necessary, and expand our learnings, while staying laser focused on getting to a set of metrics that best describe what our users do, what they think about their experience, and the impact that each future release might have on the company’s bottom line.
Where We’re Going
We’ve now had a chance to present the benchmark and our comparison study to executive leadership across the company. Although it may be too soon to assess the impact definitively, it’s started to change the conversation about design. Instead of feedback from our product partners and executives focusing primarily on colors, fonts, and whitespace, we’ve seen some early evidence of more substantive discussions regarding our designs’ measurable impact.
When our UX team first joined the organization, no one talked about design and metrics in the same sentence. Now, User Experience is not only garnering more interest and getting more attention within our own division, but also across the broader company—especially from other UX design teams and their leadership.
The leaders of development teams are now trying to leverage the momentum of our UX ROI measurement plan by attempting to measure and make similar connections between development metrics and the company’s KPIs. We’re also starting to hear the terms ROI and success metrics in conjunction with design in a lot more meetings and conversations
In partnership with our Analytics team, we’ve been able to confirm that the top tasks we identified are, in fact, primary conversion funnels for our users. We’re currently using them to tag key navigational elements and pages. We know this is only the start, but we’ve seen a significant change from the more siloed approach to product development that we encountered when the UX team first joined the organization.
While all of this has been exciting, and we’ve accomplished more than we could have imagined, we know there is still considerable work to do. We are aware of the old statistics maxim, “Correlation does not imply causation.” So we’re continuing to work with our CFO and CX partners to understand what circumstances in the broader economy or within the company might impact the company’s KPIs, as well as our team’s UX’s efforts.
Next Steps: Forecasting and Predictive Modeling
The next article in this series will focus on our efforts to develop predictive models that we’ve based on an identified correlation between UX metrics and enterprise company KPIs.
Chandler, Clay, Erika Fry, Leigh Gallagher, Beth Kowitt, Michal Lev-Ram, Andrew Nusca, Brian O’Keefe, Rick Tetzeli, and Debbie Yong. “Business by Design.” Fortune Magazine, December 22, 2017. Retrieved January 30, 2018.
Hammonds, Keith. “Michael Porter’s Big Ideas.” Fastcompany.com, February 28, 2001. Retrieved January 30, 2018.
Great comprehensive review of your process here. A question about Benchmarking the User Experience, specifically:
“Using a subset of the key tasks we had identified through our top-task survey, we conducted a benchmark study. We employed a combination of remote moderated and unmoderated methods, which let us establish a baseline…”
What types of questions did you use to get quantitative data regarding the key tasks? Were they simple binary, Yes/No questions? Anything about task completion time? I feel we have a need for that and I’m trying to figure out how to best get quantitative data for reporting.
Such a level of detail triggered memories. We got going with the process, but it was so difficult to recapture what we did unless someone was taking notes! :)
Sam—Apologies for the delay in replying to your comment. Feel free to check out the video and deck from my presentation “Communicating the ROI of UX within a Large Enterprise and Out on the Streets” from the recent Enterprise UX 2018 conference. “EUX 2018 Program”
You’ll see a dashboard slide with a suggestion of some of the metrics we used in addition to the standard, success/failure, task time and satisfaction metrics. Thanks for your interest.
Burcu received her PhD in Comparative Media at Indiana University, Bloomington, in 2009. She completed her Postdoctoral research on emerging media technologies at Lawrence University, in Wisconsin. Her academic research has focused primarily on the Internet. She has conducted cyber-ethnographic research and participatory observation to gain insights into online communities. In addition to her academic work, Burcu has worked as a consultant and researcher for various companies. At ADP’s Innovation Center, she works with a group of talented UX specialists who are designing the next generation of human capital management software. Read More
Ben’s interest in understanding people’s motivations, behaviors, and needs began as a school counselor in North Carolina. That experience led to a career in research, as a Manager in the Global Consumer Insights team at Mattel, Inc. He was attracted to the field of User Experience because of his enthusiasm for moderating customer interviews and ensuring that meeting their needs is the primary focus throughout the development of a product. Read More
Principal, UX Strategy & Research at ADP Innovation Center
Adjunct Assistant Professor at Art Center College of Design
Pasadena, California, USA
For more than 15 years, JD has successfully led the introduction of user-centered research initiatives for a variety of entertainment, automotive, and medical products, working for both disruptive startups and enterprise organizations, including Yahoo, Disney, Idealab, DirecTV, Kelley Blue Book, Kaiser Permanente, and Daqri. She is a passionate advocate of collaborative, cross-functional design, multimethod user research, and data triangulation. Her work inspires and informs innovative solutions. Read More